Back in 2017 I decided to create a video series that explains the transition to renewable energy and the risks of climate change. I thought I could have it done in a few weeks. How wrong I was! It took me several years to wrap my head around this vast topic, but I believe I now understand it well enough to help others do the same.
The goal of this post is to help you understand why people constantly argue about energy, what climate change is and how much it matters, why we haven’t transitioned to renewables yet, and where you fit into all of this. By understanding the topic from the ground up, you can become able to filter through headlines and news stories, distinguishing between those that are worthy of your attention and those that are merely exaggerated techno-optimism or fear-mongering. You can thus become immune to being misled by poorly informed journalists, politicians, activists, content creators, influencers, and dumb people in comment sections everywhere.
I think the main message can be summarized in seven major points:
- We are a fundamentally fossil fueled civilization and will remain so for many decades.
- Renewable energy sources and electricity storage have several major drawbacks that complicate their displacement of fossil fuels.
– Low surface power density
– Volatility and intermittency
– Energy only in the form of electricity - Fossil fuels must be phased out, regardless of their advantages.
– Finite supply
– Climate change - Warming in excess of 2°C relative to pre-industrial times is virtually guaranteed.
- Warming of 2-3°C relative to pre-industrial times is NOT an existential threat to humanity in the 21st century, but it is for many other species.
- The transition to renewable energy is possible. Several high-income countries are on track to get the majority of their energy from non-fossil sources by 2050. Achieving global net-zero greenhouse gas emissions is expected to be a lengthy process, taking multiple generations to complete.
- There are ways you can support the transition to renewable energy.
If any of these points appear surprising or incorrect, I invite you to watch the videos and read this post to see the reasoning behind them.
Let’s begin!
Introduction – Understanding energy units and the various forms of energy
Before delving into more intricate discussions, it’s essential to grasp the fundamentals. This includes understanding the basic units of energy and power, the concept of energy, and its transformation from one form to another. These two videos explain what you need to know.
Key Point # 1 – We are a fundamentally fossil fueled
civilization and will remain so for many decades.
The modern world’s consumption habits, diets, population size, economic systems, cities and infrastructure are all designed around fossil fuels.
Transitioning to renewable energy requires revolutionizing almost every major economic sector: raw material production, construction, manufacturing, agriculture, and transportation. New major industries dedicated to green hydrogen production and cost-effective stationary batteries must be set up. Mining operations for rare metals need to expand at least 5-fold. Virtually all of the world’s cars, trucks, tractors, ships, planes, furnaces, factories, power plants, and transmission lines must be replaced or modified. Economic systems and consumption habits must adapt to these changes. Lifestyles and ambitions must adjust to new realities.
Completely abandoning fossil fuels essentially requires a major redesign of modernity. Such fundamental changes can only occur gradually over the course of many decades.
Key point #2 – Renewable energy sources and electricity storage have several major drawbacks that complicate their displacement of fossil fuels.
Fossil fuels have four key advantages: they possess high energy density (large amounts of energy per mass and volume), they can be extracted with high power density (large amounts of energy from a relatively small land area), they are excellent storage mediums, and their chemical composition makes them suitable feedstocks for creating other chemicals and materials.
The world now uses fossil fuels at a rate of about 16 billion tonnes per year: 8 billion tonnes of coal, 4 billion tonnes of crude oil, and 4 billion tonnes of natural gas. In volume terms, that’s more than one cubic mile of each. The global demand for energy, including fossil fuels, is still rising every year as billions of people in developing nations improve their living standards.

Remarkably, humanity’s energy consumption has grown to such an extent that only two natural renewable energy flows can fully satisfy our demand: solar and wind. The extractable reserves of geothermal, tidal, wave energy, photosynthesis, and stream runoff are insufficient: even with full utilization of current technology, these energy sources fall short of powering our modern society. And sunlight is the only form of renewable energy that can comfortably cover not only today’s energy demand but also any level of global energy demand realistically imaginable during the 21st century (for example, if 10 billion people will consume like Americans or Europeans).
| Renewable energy resources and extractable reserves (in terawatts, TW) | ||
| Total resource | Extractable reserve | |
| ☀️ Solar radiation | 120,000 | 15,000 ✅ |
| 🌪️ Wind | 870 | 70 ✅ |
| 💧 Flowing water (rivers, streams) | 12 | 2 |
| 🌊 Ocean waves | 60 | 3 |
| 🌎 Tides | 3 | 0.06 |
| 🌋 Geothermal | 45 | 9 |
| 🍃 Photosynthesis | 130 (70 ocean + 60 land) | unclear: the more plant material we harvest, the less food and habitat remains for other lifeforms |
| Humanity’s energy use rate | 18 TW | |
| Humanity’s energy use rate with 10 billion people consuming like middle-class Europeans (100 GJ/year) | 32 TW | |
But despite their abundance, solar and wind energy flows have three major drawbacks that complicate their displacement of fossil fuels: (1) low surface power density, (2) intermittency, and the fact that they (3) deliver energy only in the form of electricity. I’ll explain these one by one.
2.1 – Low Surface Power Density
Surface power density refers to the rate of energy flow per unit of land area. It tells you how much power you can get from different sources for a given amount of land and is usually quantified in watts per square meter (W/m2) as a yearly average. In other words, surface power density tells you how much land you need and how many machines you must build to get your energy from a particular source. The lower the number, the more land and infrastructure you need. The higher the number, the less land and infrastructure you need.
Fossil fuels are extracted with high power densities, typically around 1,000 W/m². However, these values can vary significantly, from a lower limit of approximately 50 W/m² for depleted or low quality deposits to well over 10,000 W/m² in the most productive oil and gas reservoirs or thick bituminous coal seams.
Oil and gas extraction at power densities of thousands of watts per square meter explain how tiny Middle Eastern countries like Qatar and Kuwait can be among the world’s largest energy exporters. They extract enormous amounts of energy from tiny land areas. Even after including the footprint of the infrastructure needed for transportation, processing, conversion to electricity, transmission, and distribution, fossil fuels typically provide energy at power densities in the range of 250-500 W/m².
In contrast, renewable electricity and biofuels exhibit power densities one to five orders of magnitude lower. The range extends from a maximum of about 60 W/m² for highly efficient solar photovoltaic panels installed on rooftops in desert regions, to a dismal 0.1 W/m² for some liquid biofuels, such as biojet fuel made from canola oil.
| Surface power densities for different energy sources(watts per square meter, W/m2) | ||
| Average | Range | |
| Fossil fuel extraction1 | 1,000 | 50 – 10,000+ |
| Fossil fuel energy1(including transportation, processing, conversion to electricity, transmission, and distribution) | 250 – 500 | 20 – 5,000+ |
| Natural gas electricity6 | 1285 | 500 – 2,000 |
| Nuclear electricity2 | 590 | 200 – 1,300 |
| Coal electricity6 | 125 | 100 – 1,0001 |
| Solar PV (rooftop)5 | 35 | 10 – 90* |
| Concentrated solar power2 | 20 | 5 – 50 |
| Solar PV farms4(including panel spacing) | 15 | 5 – 20** |
| Geothermal electricity2 | 5 | 0.1 – 15 |
| Hydroelectricity1(reservoir surface) | 3 | 0.01 – 50 |
| Large-scale wind farms3(including turbine spacing) | 1 | 0.5 – 5*** |
| Tree plantations1 | 0.5 | 0.1 – 1.5 |
| Liquid biofuels1 | 0.1 | 0 – 0.5 |
| Humanity’s energy use rate | 18,000,000,000,000 W | |
| Future energy use rate? | 32,000,000,000,000 W (10 bil people x 100 GJ/year) | |
1 – Smil (2015) Power Density: a key to understanding energy sources and uses
2 – Nøland (2022) Spatial energy density of large-scale electricity generation from power sources worldwide
3 – Harrison-Atlas (2022) Dynamic land use implications of rapidly expanding and evolving wind power deployment
4 – Bolinger (2022) Land Requirements for Utility-Scale PV: An Empirical Update on Power and Energy Density
5 – My estimate based on 170 W/m² average global insolation and 20% efficient panels (range: 15% efficiency with 90 W/m² insolation – 30% efficiency with 300 W/m² insolation)
6 – van Zalk (2018) The spatial extent of renewable and non-renewable power generation: A review and meta-analysis of power densities and their application in the U.S.
* Solar PV panels may eventually reach 50% efficiency and deliver a maximum of around 120 W/m² in desert regions.
** Solar farms may eventually reach 50 W/m² in desert regions.
*** Smaller-scale wind farms operating in exceptionally windy locations may deliver up to 10 W/m²
Renewable energy generation is limited to relatively low power densities because natural energy flows are inherently diffuse: the annual average global solar irradiance is about 170 W/m², and the average kinetic energy of near-surface winds is about 1 W/m². Modern solar panels are 20-40% efficient at converting light into electricity and wind turbines are around 45% efficient at converting the kinetic energy of wind into electricity. This means that on a global scale, solar power generation is limited to an average of 30-70 W/m2 and wind power generation to about 0.5 W/m2. But these numbers can be two to six times higher in desert regions and exceptionally windy locations – marked with orange and red on the maps below.


Low power density is a drawback because it makes renewable energies extremely land and material intensive. The land intensity stems from the fact that to meet humanity’s energy needs, large tracts of land must be dedicated to these energy sources, as the energy yield per unit area is relatively low compared to fossil fuels.
The following infographic illustrates the land areas required to power the island of Manhattan, New York at the rate of 10 gigawatts from different energy sources (based on average U.S. power densities from van Zalk, Bolinger, and Harrison-Atlas). You can see that it takes at least one, usually two, and sometimes three orders of magnitude more land to produce the same amount of energy from renewable sources than from non-renewable sources. All elements in this graphic are accurately represented to scale, as you would see them on Google Maps. This includes the rectangles’ areas in relation to Manhattan island, as well as the objects depicted within the rectangles, such as coal and uranium mines, power plants, oil fields and refineries, solar arrays, and so on.


The numbers:
Manhattan population: 1.7 million
Average new yorker energy use: 190 GJ/year
Island energy use rate: 1.7 mil x 190 GJ = 323 PJ / 31,536,000 = 10 GW or 115 W/m²
Useful energy (assumption): 10 GW
Natural gas electricity: 10 GW / 1285 W/m² = 8 km²
Nuclear electricity: 10 GW / 290 W/m2 = 35 km²
Crude oil energy at 25% conversion efficiency: 10 GW / 0.25 = 40 GW | 40 GW / 500 W/m² = 80 km²
Coal electricity: 10 GW / 125 W/m² = 80 km²
Solar PV farms: 10 GW / 15 W/m² = 665 km²
Hydroelectricity: 10 GW / 3 W/m² = 3,335 km²
Wind farms: 10 GW / 1 W/m² = 10,000 km²
Tree plantations: 10 GW / 0.5 W/m² = 20,000 km²
Liquid biofuels: 10 GW / 0.1 W/m² = 100,000 km²
The low power density of renewables is not that big of an issue for countries with large territories and small populations – such as Australia, Canada, Namibia, or Argentina. But regions with high population densities and high energy consumption per capita are going to struggle to meet their energy demand on their own renewables due to lack of available land and NIMBY pushback (“not in my back yard” – a phenomenon where residents refuse to allow the construction of large energy facilities in their local area).
The graphic below shows the average power consumption per unit area in different countries. The size of the circle represents the country’s population. Its position on the graph shows the average rate of energy use per person and the population density. The smaller the circle is, and the closer a country is to the lower left corner of the graph, the easier it will be for that country to fit the necessary solar parks, wind farms, and other renewable energy facilities on its territory without pushback from the population. On the other hand, the larger the circle and the closer a country is to the upper right corner of the graph, the more difficult it will be for that country to meet their energy demand on their own renewables.

The diagonal lines across the graph show the average power consumption per unit area. For example, the average power consumption per square meter in Brazil is 0.05 W/m2 while in Qatar it’s one hundred times higher at around 5 W/m2. You can use these numbers to estimate the percentage of land required to meet a country’s energy demand with a specific energy source. In countries such as Germany, the UK, and Japan the power consumption is around 1 W/m2. This means that if you wanted to power these countries with wind farms which deliver electricity at 1 W/m2, you would have to cover literally the entire country with wind farms. If you wanted to power them with solar farms which deliver 10 W/m2, then you would need 10% of the territory. If you wanted to power them with liquid biofuels, well, you couldn’t…because the power consumption per square meter exceeds the power density of biofuels.
The lines behind some of the circles show the movement of several countries since the year 2011. You can see that most Asian and African countries have increased both their energy use per capita and population densities. This trend will continue throughout the twenty-first century until all nations will be above at least 1,000 W/person. If the graph was animated until the year 2050, you would see developing countries moving rapidly upwards and to the right and developed countries remaining relatively stable or shifting slightly downwards or to the left (reflecting improvements in energy efficiency and lower birth rates). In other words, if you looked at this graph in the year 2050, the green zone would be mostly empty, except for the upper left corner.
The following graphics depict the land requirements for powering Germany and the UK in a 2050 hypothetical scenario where energy demand decreases by 35% and solar farm power densities improve to 15 W/m² at higher latitudes. In this scenario, Germany and the UK would need to cover about 20% of their land areas with wind farms and solar farms (or place them offshore). I’ve also added liquid biofuels to the mix so you can see how much land would be needed to provide just 1% of the energy.


Much more land would be needed at current energy demand and power densities. For instance, German solar farms currently generate electricity at an average rate of 5-10 W/m², while large wind farms produce at 1-2 W/m². To meet Germany’s primary energy demand of 390 GW using 54% solar and 40% wind power, an area between 100,000 and 200,000 square kilometers would need to be dedicated to these energy sources. That’s 25-50% of Germany’s total landmass!
Countries with low population densities or low energy consumption per person will have a much easier time. The graphics below depict the land requirements for powering Romania and the United States in the same hypothetical scenario. You can see that only about 5% of the territory would be required for energy production. Australia would require less than 1% – despite having one of the highest per capita energy consumption rates in the world, Australia has a very low population density.


But land availability is typically not seen as a significant obstacle in the shift towards renewable energy. This is because analysts assume that solar panels and wind turbines will be placed on agricultural land, co-existing with crop cultivation through the practice of agrivoltaics. This means that the land between solar panels will be used to grow crops and graze animals. Whether that’s true remains to be seen. Instead, the low power density of renewable energy is seen as a drawback mainly because it translates into high material demand: enormous amounts of materials are needed to construct the wind turbines and solar panels that must be deployed across these vast areas to harness diffuse energy flows.
The infographics below illustrate the material requirements for substituting one small-scale natural gas power plant with either wind turbines or solar panels. To match the annual electricity generation of the gas power plant, we need to build 70 giant 5 MW wind turbines or 840,000 solar panels (500 W each).


In this example, wind and solar power require at least five times more materials overall and ten times more metals: mostly steel but also hard-to-mine elements such as copper, nickel, neodymium and silver. And it’s important to highlight that the solar calculations are based on a high capacity factor of 25%, which is typically only achievable in desert regions. In countries like Germany and the UK, the average solar capacity factor is around 12%, implying that the actual number of solar panels required in such regions would be twice as many as shown here.

Click here to see the numbers and the sources
In addition to the substantial use of bulk materials like concrete and steel, the production of wind turbines and solar panels requires the use of energy-intensive materials. These include copper, aluminum, fiberglass, carbon fiber and silicon, along with rare metals such as neodymium, dysprosium, silver, gallium, tellurium, and indium. Currently, the global capacity for mining and processing most of these critical materials is insufficient to meet the demand for manufacturing wind turbines and solar panels at the rate required for a worldwide shift to renewable energy by 2050. According to estimates by the World Bank, the International Energy Agency, the International Renewable Energy Agency, the European Commission, and the US Department of Energy, mining operations for several metals need to increase by 5-20 times to prevent bottlenecking the adoption rate of renewable energy.
This can be done. The Earth’s crust contains all the metals we need for the energy transition. The problem is that mining is an industry that has long project development timelines. It typically takes 5-15 years from the discovery of a mineral deposit to large-scale production, and this raises doubts over the industry’s capacity for rapid expansion. Furthermore, mining projects often face resistance from local communities due to their potential impact on local biodiversity and water bodies. For instance, consider silver mining which is essential for high-efficiency solar photovoltaics. In 2016, the average yield of the world’s best silver mines was about 265 grams per tonne of ore. This implies that to extract one kilogram of silver (enough for about 200 solar panels), one must mine and process about 3,775 kilograms of minerals and discard 3,774 kg of polluted tailings – without counting the contaminated water. Even when mining is done according to environmental regulations and safety measures, local communities may remain opposed to having a giant excavation site and a lake of hazardous waste in their vicinity.

As of the year 2024, more than 80% of the critical minerals required for the manufacturing of solar panels and wind turbines are supplied by China – a country whose mining practices often disregard environmental protection and public health. For instance, the Bayan’obo Mining District and the Baotou processing plants in Inner Mongolia are known for causing heavy-metal pollution in soil and water which increases the cancer risk for those living near these contaminated mining areas. And yet, these facilities are vital to the global supply of wind turbines, solar panels, and electric vehicles.
2.2 – Volatility and intermittency
Volatility and intermittency refer to the dependability of energy sources, indicating the proportion of time they can be relied upon. Fossil fuels are a consistent and dependable source of energy. As long as wars or other unforeseen events don’t disrupt the supply, fossil fuels can be extracted year-round, traded internationally via pipelines, trains and ships, stored indefinitely without any energy loss, and burned whenever needed to match the demands of industry or residential heat and electricity.
In contrast, electricity generation from wind and solar is highly volatile. The output can change significantly from one second to the next, and also fluctuates over longer periods such as days, seasons, and years. This is because the intensity of wind and sunlight is influenced by the day-night cycle, cloud cover, weather conditions, and seasonal variations in daylight hours and temperature.
| Examples of recorded wind and solar power intermittency at different timescales | ||
| Timescale | Wind | Solar |
| 1500 seconds | output of a 3 MW wind turbine on Jeju Island, South Korea | average output of 442 solar panels on a partly cloudy morning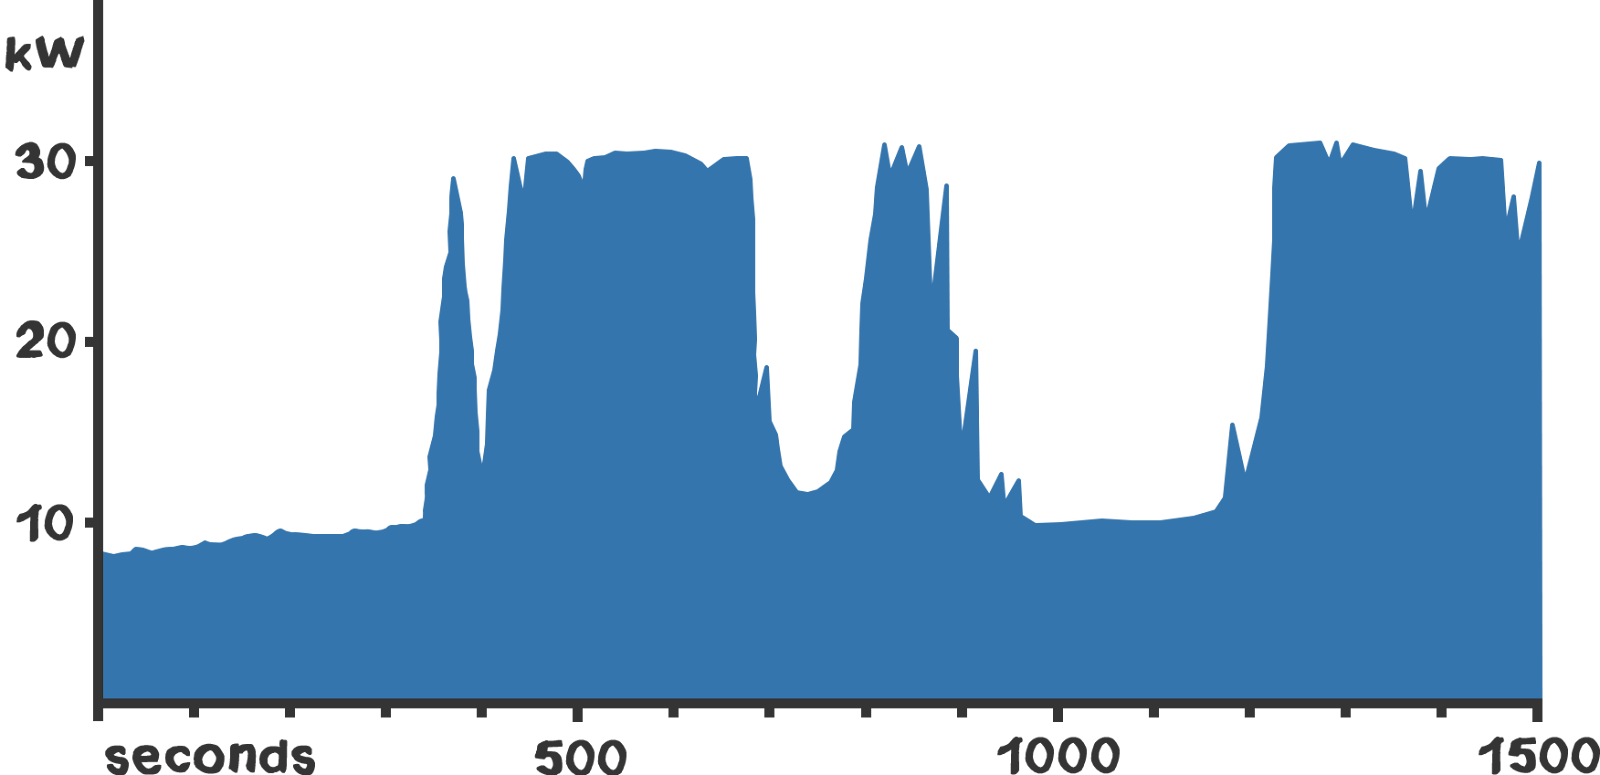 |
| One day | output of a 25 MW wind farm (12 turbines)in Germany on a typical summer day 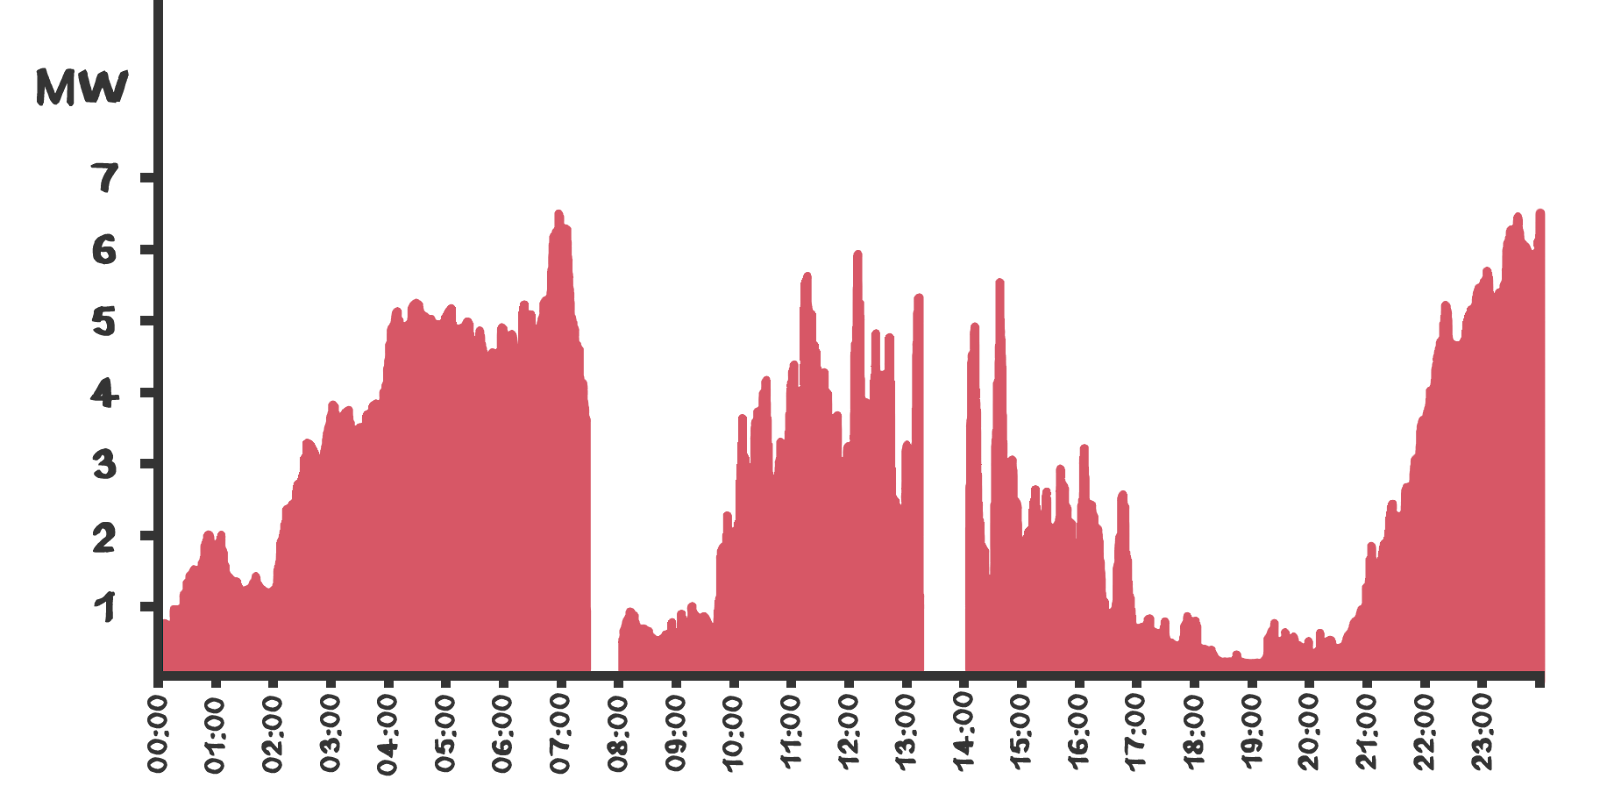 | output of 2.9 GW of solar PV plants in Gujarat, India duringthe monsoon season, 23 July 2006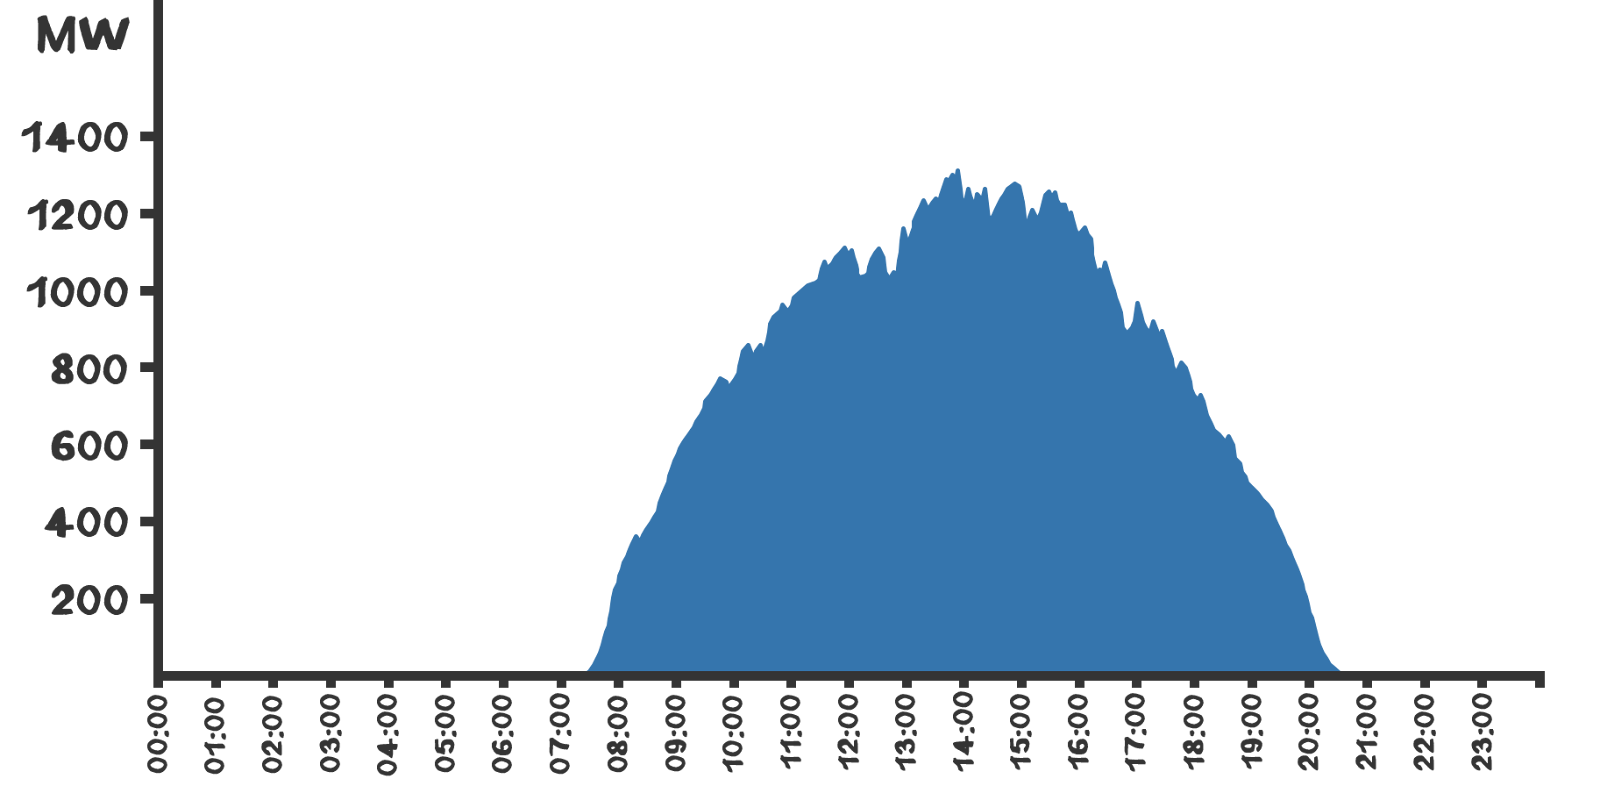 |
| One year | wind electricity generation in the European Union in 2014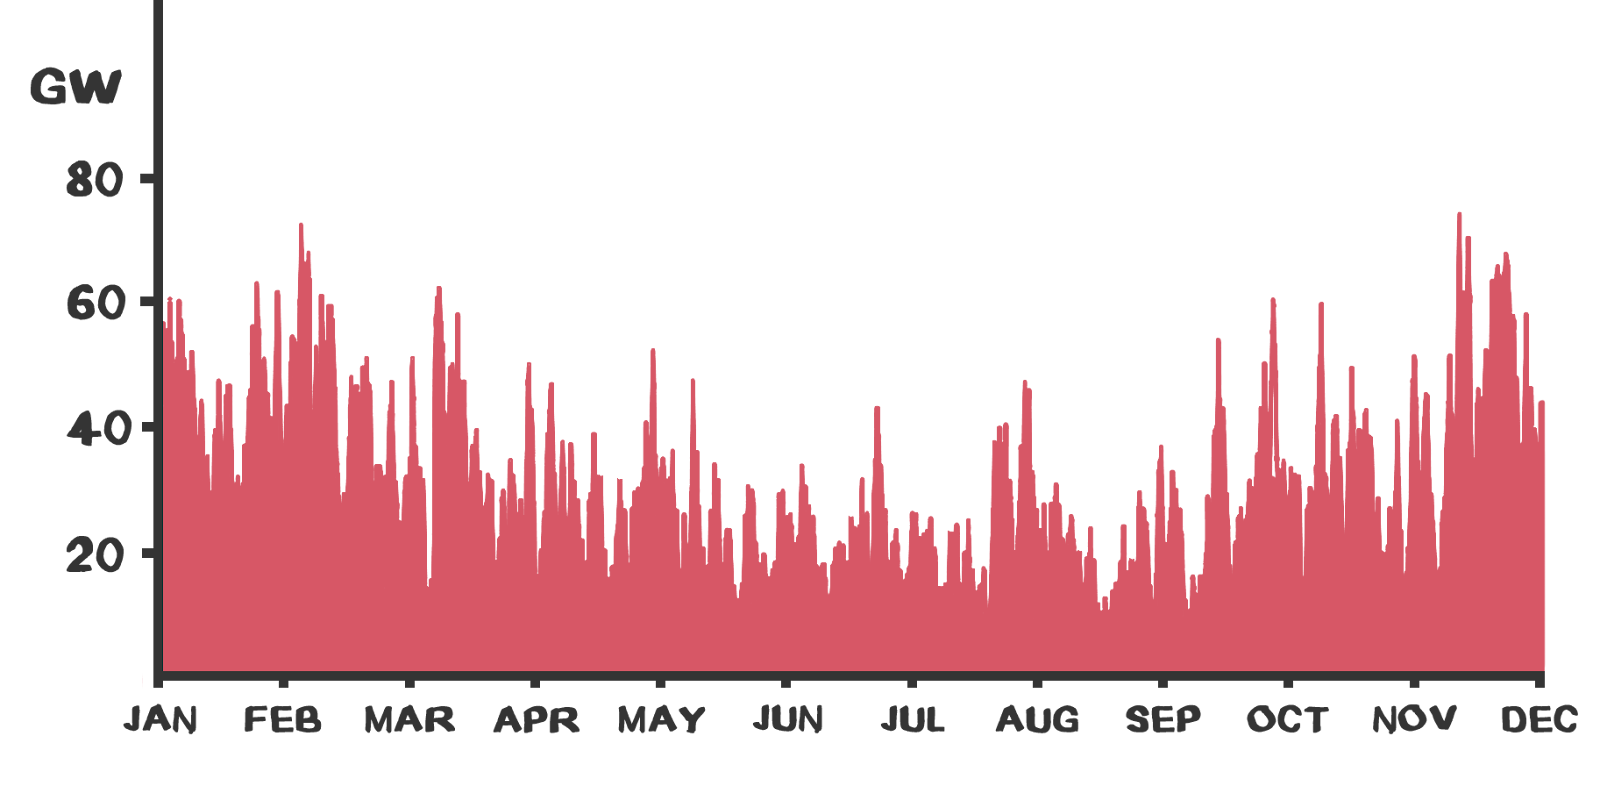 | solar electricity generation in the European Union in 2014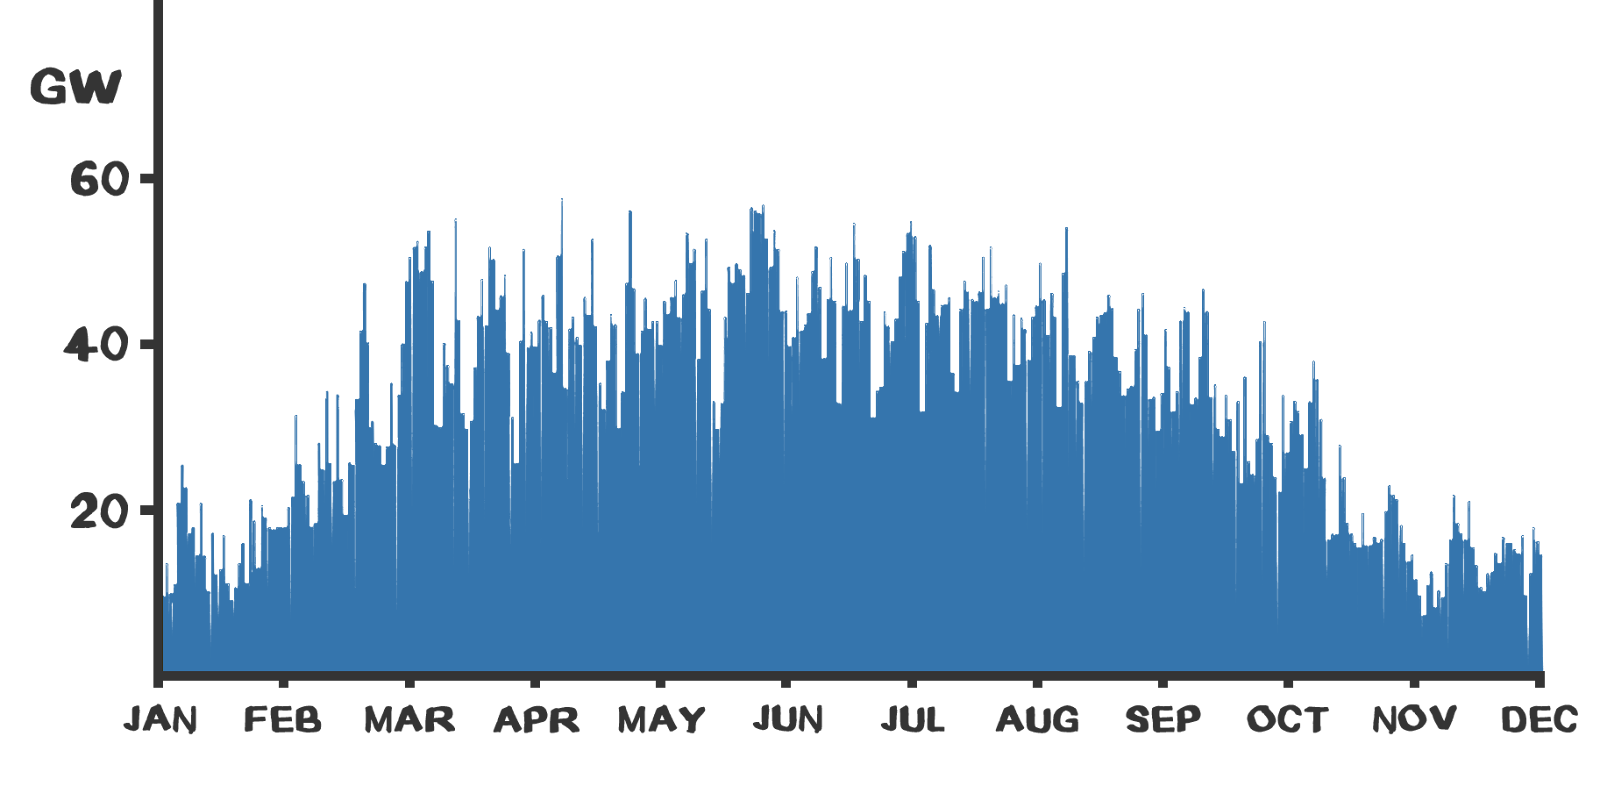 |
| Twenty years | wind electricity that would have been generated annuallyin Germany with the same number of turbines as in 2017 | annual variation in solar energy reaching the surface in two US cities: Los Angeles and Seattle |
sources:
25 minutes wind: Chase (2020) – Field Test of Wind Power Output Fluctuation Control Using an Energy Storage System on Jeju Island (figure 12)
25 minutes solar: Kreuwel (2020) Analysis of high frequency photovoltaic solar energy fluctuations (fig. 1b from 9:55 to 10:20)
one day wind: Rob West, Thunder Said Energy – Wind volatility: second by second output data?
one day solar: Hummon (2014) Variability of Photovoltaic Power in the State of Gujarat Using High Resolution Solar Data (fig. 20c orange line)
wind and solar one year: Butler (2016) Variability of wind and solar power – An assessment of the current situation in the European Union based on the year 2014 (fig. 4)
twenty years wind: Jung (2018) On the inter-annual variability of wind energy generation – A case study from Germany (fig. 6)
twenty years solar: Rob West, Thunder Said Energy – Solar volatility: interconnectors versus batteries?
Short-term volatility, ranging from seconds to minutes, is problematic because it disrupts the stability of the power grid. The seamless operation of the grid depends on the maintenance of a specific current frequency and an almost perfect balance between supply and demand. Feeding intermittent electricity into the grid disrupts the supply side and raises the risk of blackouts and equipment malfunctions. This instability is particularly problematic for sectors that require a consistent electricity supply, such as heavy industries or large data centers, which cannot afford intermittent power drops. When solar and wind contribute less than about 30% of the electricity in the grid, their volatility can be offset by conventional power plants. But as the proportion of renewable energy sources feeding into the grid grows, maintaining grid stability becomes more complex and costly, requiring the use of flywheels, supercapacitors, batteries, interconnectors, and back-up generators to smooth out the power supply.
Medium and long term output fluctuations spanning days and seasons raise concerns about energy shortages. Instead of having energy whenever we need it, far less would be available during nighttime, during calm weather when wind turbines don’t work, and during winter months when daylight is limited and solar PV energy production is reduced. For example, in northern countries such as the UK and Germany, approximately 75% of the electricity generated by solar panels is produced between April and September and only 25% between October and March. Fortunately, wind farms produce around 65% of their annual electricity output during the colder months, so they can mostly compensate for reduced solar PV energy production. But the hourly and daily variation remains a problem. The wind may stop blowing completely for a few hours a day in any given location, and even on a national scale, some days are simply not very windy, with wind electricity generation falling to less than half of the previous day’s level. Worse, long-term data shows that each year tends to have a period of around five consecutive days with very little wind (average wind capacity factor below 10%), and such periods can cause severe energy shortages if they occur in winter (they usually occur in summer).
Another consequence of daily and seasonal variations in production would be large energy price volatility. On clear summer days, solar farms could produce energy in excess of what’s required, thereby lowering prices during daylight hours. But on calm winter nights when neither wind turbines nor solar panels generate energy, scarcity could cause prices to skyrocket. Prices would also be disrupted by the small interannual fluctuations in wind and solar energy supply, which typically amount to +/- 5% from year to year in a given location. During years with abundant sunshine and wind, energy would be plentiful and cheap. But during years with unusually calm and cloudy weather, energy would become more scarce and expensive. Remember how much the Covid-19 lockdowns affected energy prices in 2020? Well, the global energy demand fell by only about 5% that year. A future energy system based on wind and solar would have to handle such supply-demand volatility on an annual basis. This would be comparable to Saudi Arabia’s entire oil supply vanishing from the market one year, then magically reappearing the following year. Or losing the entire energy demand of India one year, then having it reappear the following year.
Overcoming the medium and long term intermittency of renewable energy is arguably the biggest challenge of the energy transition. Many potential solutions exist. Five options hold the most promise: back-up generation capacity, overgeneration of wind and solar energy, intercontinental grids, large-scale energy storage, and demand shifting. The cheapest and most reliable solution will likely come from using a combination of these options. However, putting them into action is difficult because each option is hampered by at least one of the following obstacles: ⚫ need for carbon capture and storage, 🔴 high demand for critical metals, 🟣 vast scale requirements, 🟢 need for international cooperation, 🟡 low energy density storage, 🔵 energy loss over time, 🟤 large energy price volatility, ⭕ reduced economic productivity, 🟠 low round-trip efficiency, and ⚪ NIMBY pushback.
The graphics below briefly explain what each option means and how it works. The colored circles show what keeps it from being the ideal solution to wind and solar intermittency.


Obstacles and drawbacks:
⚫ need for carbon capture and storage
🔴 high demand for critical metals
🟣 vast scale requirements
🟢 need for international cooperation
🟡 low energy density per mass, volume, or both (low = less than 1 MJ/kilogram or less than 1 MJ/liter)
🔵 high energy loss over time (unsuitable for long duration storage)
🟤 large energy price volatility
⭕ reduced economic productivity
🟠 60-70% round-trip efficiency (energy loss between 30 and 40%)
🟠🟠 20-60% round-trip efficiency (energy loss between 40 and 80%)⚪not in my back yard – NIMBY
The crux of the intermittency issue lies in our current inability to store renewable energy cheaply and efficiently. Energy storage is where fossil fuels really excel. Although fossil fuels are commonly thought of as energy sources, their value for the global economy becomes more apparent when you think of them as forms of energy storage. Their exceptional storage properties largely explain why they’re so hard to replace by renewable electricity. Fossil fuels (particularly oil products) have high energy density at ambient temperature and pressure, are reasonably safe, not especially corrosive, easy to transport and contain, lightweight yet dense enough to fuel extremely long-range vehicles (jetliners and ships), and are indefinitely storable without loss of energy. No alternative electricity storage technique or renewable energy carrier offers all these benefits, be it batteries, hydrogen, flywheels, or compressed air. If we had an alternative cheap and high-energy density storage medium, most of our energy and climate problems would be solved.
| Approximate energy density of different fuels and storage mediums | ||
| megajoules per kilogram (mass) | megajoules per liter (volume) | |
| Bituminous Coal | 30 | 32 |
| Crude oil | 42 | 37 |
| Natural Gas | 54 | 0.03 |
| Commercial lithium batteries | 1 | 2.5 |
| Cutting-edge batteries | 2 | 5 |
| Hydrogen gas | 120 | 0.01 |
| Liquid hydrogen | 120 | 8 |
| Hydroelectric dam (100 m) | 0.001 | 0.001 |
| Flywheel | 0.4 | 5 |
| Compressed air (30 MPa) | 0.5 | 0.2 |
To get a sense of how difficult large-scale energy storage is, the graphics below illustrate what it would take to store just 0.25% of the world’s annual energy use (enough for a single day*) using the two most dominant energy storage systems currently in use: pumped hydro storage and lithium-ion batteries.
*Note: this does not literally mean one day when the world’s solar panels and wind turbines produce nothing, but rather 20 days when they produce 95% of what we require or 50 days when they produce 98%. In either case, the deficit is equivalent to not having solar parks or wind farms for an entire day of the year. Given the seasonal and annual fluctuations of solar and wind power, assuming we only need to store 0.25% of our annual energy consumption is very conservative. We likely need many times more.
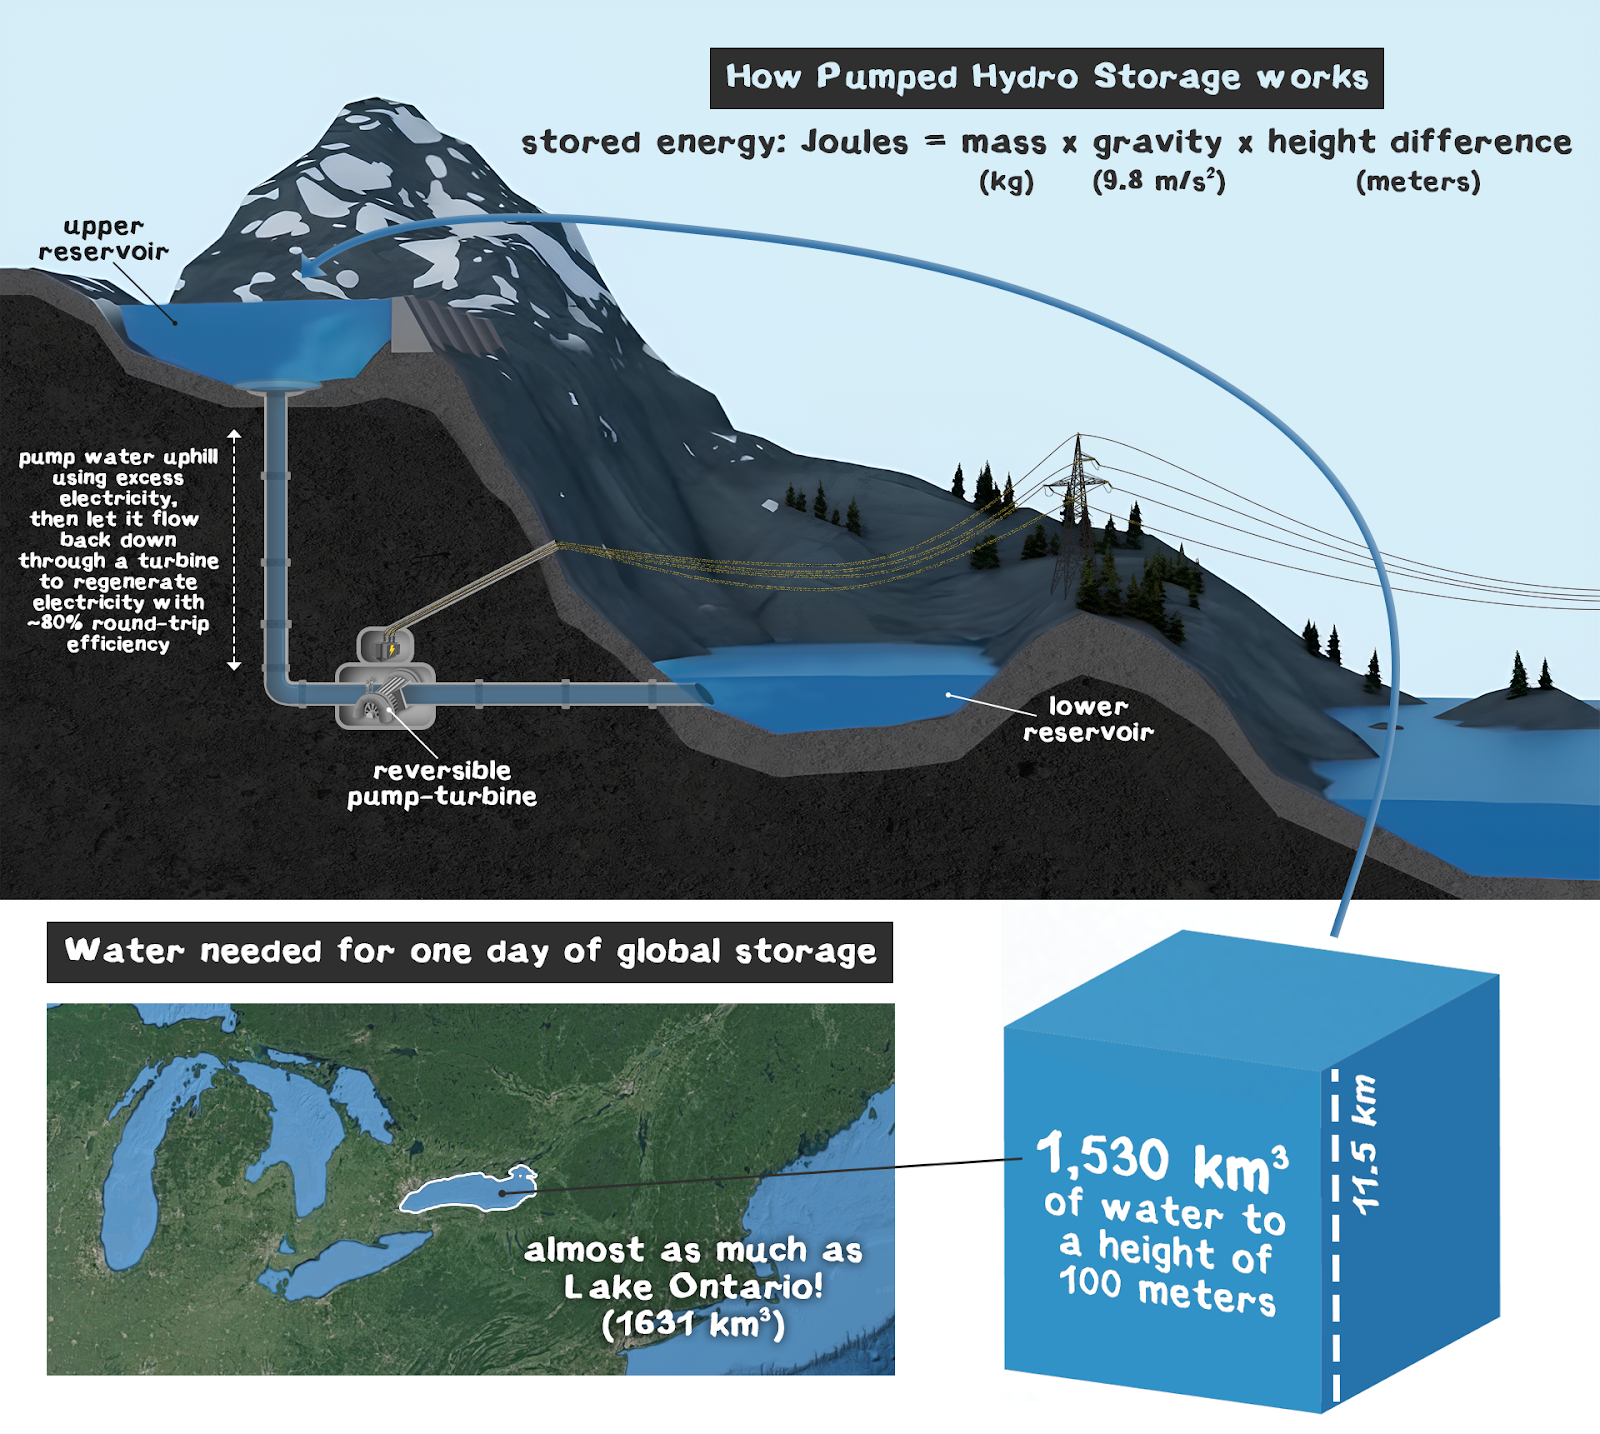
Pumped hydro storage involves using excess electricity to pump water from a reservoir at a lower elevation to another reservoir at a higher elevation. This process stores the energy as gravitational potential energy. Later, when there’s a shortage of energy, the water is released to flow down through a turbine, converting the potential energy back into electricity with ~80% round-trip efficiency. The problem is that gravitational storage has very low energy density (see table above). To store the world’s energy needs for a single day, we would need to pump a volume of water equivalent to 1,530 cubic kilometers to a height of 100 meters. That’s a volume of water almost equivalent to Lake Ontario!

The Bath County pumped hydro station is one of the largest in the world. Its upper reservoir can hold about 45,000,000 m3 or 0.045 km3. If we made all the upper reservoirs as large as the one at Bath County and they were all at a height of 100 meters relative to the lower reservoir, we’d need about 35,000 of them! The reservoirs at Bath County have a combined surface area of 3.3 km2. 35,000 such stations would therefore occupy a total area of 115,500 km2. That’s equivalent to the surface areas of lakes Huron and Michigan combined! Building so many reservoirs around the world would be extremely difficult due to the amount of concrete required for the dams, lack of suitable terrain, and lack of water.

In the case of lithium-ion batteries, we would need to manufacture 4,8 trillion 4680-type cells. That’s 265 times more lithium-ion battery storage capacity than the world produced in 2022! At 0.355 kg each, these cells would weigh 1.7 billion tonnes. Assuming a low content of 0.1 kg/kWh, the lithium requirements would be 41.6 million tonnes, roughly 40% of the global resources known in 2023.
Of course, we could use a combination of different types of energy storage technologies. But as mentioned earlier, other options face challenges related to high daily energy losses, low energy density, or low round-trip efficiency. Hydrogen, for example, is one option that can be scaled to meet our needs. But the main issue with hydrogen produced by water electrolysis is that the round-trip efficiency is only 30-50%, which means that we would recover only about half of the electricity used to produce it.

Given the challenges and high costs associated with energy storage, current analyses suggest that natural gas back-up generation will likely be the dominant way we’ll counterbalance the intermittency of renewable energy. Energy storage is expected to play a comparatively minor role, at least for the upcoming one or two decades.
2.3 – The limits of electricity
Most people think of decarbonization as just an electricity problem: we simply need to build enough wind turbines, solar panels, and storage facilities to cover our electricity demand. Then we’re set!
But in fact, electricity cannot completely substitute fossil fuels because they are currently required as raw materials, feedstocks, or fuels by hundreds of industries that manufacture the materials and products that define modern civilization. Six of these industries could be described as the pillars of modernity: steel, cement, nitrogen fertilizers, plastics, aviation, and international shipping. Shut down these industries and humanity would be thrown back to the Middle Ages, with half of the population starving to death. However, these economic sectors also account for about 20% of total greenhouse gas emissions.

Getting these sectors off fossil fuels requires converting electricity into chemical energy, inventing new manufacturing processes, and replacing most of the existing industrial infrastructure. This is more difficult to do than to decarbonize electricity generation. To get a sense of what needs to be done, I’ll briefly describe the “Big 6” one by one.
To be clear, this is not a complete list of the things we can’t currently do with electricity. There are hundreds of other industries and sub-sectors that rely on fossil fuels without a readily available alternative. These include mining, fishing, heavy trucking, and the production of materials like rubber, glass, lubricants, non-ferrous metals, industrial gasses, paint, ink, detergents, ceramics, glue, carbon fiber, acids, pesticides, and cosmetics. Every one of these is difficult to decarbonize and while they might individually contribute as little as 0.1% to annual greenhouse gas emissions, their collective impact is significant. Therefore they must all be transformed in order to address climate change. However, my focus here will be on the larger sectors: nitrogen fertilizers (ammonia), steel, cement, plastics, aviation, and maritime transport.
2.3.1 – Ammonia
The Haber-Bosch synthesis of ammonia is the most important industrial process in the world today. Without it, we could not produce enough food to sustain nearly half of the existing population of eight billion people (well, at least not with current diets high in animal products).

The reason for this is simple: the natural nitrogen content in soil is insufficient for high crop yields. In the past, soil nitrogen levels were enhanced by the application of animal manure or guano, and the practice of crop rotation. However, these methods could not increase soil fertility enough to adequately feed the population and prevent malnutrition. Then in the early 20th century, a breakthrough occurred when chemists discovered how to convert inert atmospheric nitrogen into ammonia. This nitrogen-containing molecule could then be transformed into fertilizers that plants can absorb, significantly increasing soil fertility and crop yields. This innovation, which has revolutionized agriculture, is arguably the one that has improved the wellbeing of humanity more than any other.
The world now produces about 190 million tonnes of ammonia per year. Almost all of it is made using natural gas or coal gas, which serve both as feedstocks and fuels for the synthesis process. To explain why, I need to briefly describe the Haber-Bosch process.

Ammonia is composed of one nitrogen atom and three hydrogen atoms – NH3. To make it, we need to combine nitrogen with hydrogen. Nitrogen can easily be separated from the air (78% of air is nitrogen) but hydrogen must be extracted from a molecule because it’s not naturally found in its elemental form in meaningful quantities (only 0.0005% of air is hydrogen). Today, most hydrogen is extracted from methane through a technique called steam reforming.

A molecule of methane consists of one carbon atom and four hydrogen atoms – CH4. To extract the hydrogen, methane is mixed with steam at high temperatures where it reacts with water and is converted into a mixture of carbon monoxide and hydrogen: CH4 + H2O → CO + 3H2. The carbon monoxide then reacts with a molecule of water to produce carbon dioxide and yields an extra hydrogen molecule: CO + H2O → CO2 + H2. Steam reforming is currently the least expensive way to produce hydrogen, both economically and energetically.

Once we have elemental hydrogen, it can be used in the Haber-Bosch process. The carbon monoxide and dioxide are separated from the hydrogen which is pumped into a container together with nitrogen obtained from the air. Under a pressure of 200 atmospheres and 400 degrees Celsius and the presence of a catalyst, hydrogen and nitrogen combine to create ammonia. Ammonia is collected as a liquid and stored in tanks. It is later used to produce nitrogen fertilizers such as urea and ammonium nitrate.
The ammonia industry uses around 5% of the natural gas we extract and emits approximately half a billion tonnes of CO2e per year.
To decarbonize this industry, we need to get hydrogen from molecules that don’t leave behind carbon dioxide as a by-product. Water fits the bill. Water consists of one oxygen atom and two hydrogen atoms. By passing an electric current through it, water can be decomposed into hydrogen and oxygen. So we can extract hydrogen from water instead of methane.

In this case, the process starts by decomposing water in a large electrolyzer. The oxygen is taken out of the system and the hydrogen is combined with nitrogen to create ammonia. The Haber-Bosch process remains more or less the same, with the main difference being that the hydrogen comes from water instead of natural gas.
A few electrolysis-based ammonia plants are already in operation at commercial scale and they will become common in the next decade. But revolutionizing a major global industry takes time. Ammonia plants have long lifetimes of up to 50 years and cost hundreds of millions of dollars to build. Existing plants that are less than 20 years old will not be abandoned quickly because the initial investment must be amortized over the plant’s lifetime. Green ammonia also requires more energy to produce than natural gas-based ammonia (41 GJ/t vs. 28 GJ/t) and is 10-100% more expensive, depending on the regional costs of renewable electricity and fossil fuels. For these reasons, the IEA and IRENA project that by 2050, only about half of ammonia will be made using water electrolysis.

And unfortunately, decarbonizing the ammonia industry won’t fully eliminate the greenhouse gas emissions associated with fertilizer production and application. That’s because at least half of the total life-cycle emissions of nitrogen fertilizers come from nitrous oxide, not carbon dioxide. Nitrous oxide is a very powerful greenhouse gas. Each molecule has the same global warming effect as 296 molecules of carbon dioxide. Small amounts of nitrous oxide are created during ammonia synthesis and during fertilizer application – around 4% of the nitrogen applied to fields turn into nitrous oxide. Therefore, even if we were to produce ammonia from water and air using renewable electricity, fertilizers would still contribute to around 300 million tonnes of CO2 equivalent emissions annually (~0.5% of our total greenhouse gas emissions).
2.3.2 – Steel
Modern life is made possible by steel. Everything you see around you is either made of steel or was manufactured using tools made of steel. Additionally, steel is an essential metal in the shift towards renewable energy and decarbonization, as it is heavily used in the manufacturing of wind turbines, solar farms, transmission lines, batteries, and other energy infrastructure.

Steel can be made from two materials: steel scrap and iron ores. Steel produced from scrap is recycled steel, whereas steel produced from iron ore is new steel. Recycled steel can be made using renewable electricity by melting scrap inside an electric arc furnace. But recycled steel covers only 30% of the annual demand. New steel cannot be produced simply by melting iron ores using electricity – it also requires a chemical reaction to remove the oxygen from iron ores.
When you mine iron out of the ground you find it in the form of iron oxide: iron bound with oxygen (chemical formula FeO, Fe2O3 or Fe2O4). To make steel, you need pure iron, and separating the oxygen from the iron is the primary reason this industry uses fossil fuels. As of 2023, all new steel is made using coal or natural gas. These fossil fuels serve as sources of carbon and hydrogen which react with the iron oxide and remove the oxygen by forming carbon dioxide and water. In other words, coal and natural gas aren’t needed just because of their energy content, but mostly because of their chemical composition which produces the right reaction to remove the oxygen from the iron ore and leave behind pure iron which is later turned into steel.
Coal is by far the most used reducing agent in the steel industry. Approximately 90% of new steel is made using blast furnaces powered by coke produced from metallurgical-grade coal. Coke is essentially pure carbon and serves three simultaneous functions in steelmaking: it binds with the oxygen from the ore to produce carbon dioxide and elemental iron, its oxidation generates the high temperatures needed for melting iron, and it leaves some carbon into the molten iron (this is useful because steel is an alloy of iron and carbon).

Direct iron reduction using natural gas is a newer technology and is currently used to produce approximately 10% of new steel. It involves pumping natural gas into a kiln filled with iron oxide pellets. A methane molecule has one carbon atom and four hydrogen atoms (CH4). Both carbon and hydrogen have a higher affinity to oxygen that iron does, so at high temperatures they are able to “steal” the oxygen atoms from the iron oxide molecules and produce carbon dioxide and water. The pure iron pellets are then melted inside electric arc furnaces and turned into steel.

So in the case of steelmaking, carbon dioxide is not just a by-product of burning fossil fuels to generate heat. Rather, it is the substance we create in order to separate the oxygen from iron.
Two new technologies are currently being developed to decarbonize the steel industry: hydrogen-based direct iron reduction and electrowinning.
Hydrogen-based direct iron reduction is very similar to natural-gas direct iron reduction – in fact, the same kilns can be adapted to operate exclusively with hydrogen. Hydrogen can be produced through water electrolysis, a process that uses electricity to split water into its constituent elements, hydrogen and oxygen. The hydrogen is then introduced into the kiln where it reacts with the oxygen from iron oxides to form water. Pilot plants of this kind have already been built in Europe to address the remaining challenges of this technology. It is anticipated that the first commercial steel plant using hydrogen-based DRI will be operational after 2025.

Electrowinning is a less mature technology that is expected to enter the market only after 2040. It involves breaking apart the iron oxide molecule using electricity. It comes in two variants: low-temperature and high-temperature. The low-temperature form involves the application of electricity to an alkaline solution containing iron oxide pellets. The high-temperature variant applies electricity to molten iron oxide and other ingredients. In both cases, the electricity causes the iron oxide to break apart, resulting in pure iron and pure oxygen.
Until technologies like hydrogen-based DRI and electrowinning become commercially available, we have no means of producing steel on an industrial-scale without fossil fuels. The only option currently available is to substitute coke with charcoal derived from wood. Charcoal is essentially man-made coal and can serve the same functions as coke in conventional blast furnaces, albeit of smaller size. But the annual wood requirement would be so high that we would need to establish fast-growing tree plantations covering an area of 1.2 million square kilometers. That’s half the size of the African rainforest. Given the magnitude of the project, this isn’t something we could accomplish quickly either.

2.3.3 – Cement
In terms of sheer mass, the most important material for our civilization is cement made into concrete. Each year, we produce and consume more than 4 billion tonnes of cement and 30 billion tonnes of concrete (cement + gravel, sand, stones, crushed rubble). Concrete products are second only to water as the most consumed material in the world and they account for 5-10% of greenhouse gas emissions.
Just as in steel manufacturing, carbon dioxide emissions from cement production are not just a by-product of burning fossil fuels to generate heat. Rather, most of the carbon dioxide is produced in the chemical reaction of transforming limestone into calcium oxide – the main ingredient of cement.

Producing calcium oxide for the cement industry starts with mining limestone – CaCO3. Limestone is then ground up and heated to more than 800°C which causes the molecules to thermally decompose into calcium oxide (CaO) and carbon dioxide (CO2). This process is called calcination. The calcium oxide is then introduced into rotary kilns and melted together with other oxides (silicon – SiO2, aluminum – Al2O3 and iron – Fe2O3) at temperatures above 1500°C to produce clinker. The clinker is then cooled, ground up and combined with other materials to produce cement.
About 60% of the carbon dioxide is generated during calcination and only 40% from burning fuels to generate heat. In other words, 60% of the emissions have nothing to do with the energy source, they’re the result of the thermal decomposition of limestone.
The intense heat required for cement manufacturing could be generated by renewable electricity instead of burning fuels. However, it’s technically difficult and expensive to generate temperatures in excess of 1500°C using electricity. This matters when you consider that the cement industry utilizes some of the dirtiest and cheapest fuels available such as used tyres, plastic, paint residue, solvent, and crop residues – in addition to coal, petroleum coke, and natural gas. Using these fuels not only provides a means of waste disposal but also keeps operational costs low. Cement made with renewable electricity could be twice as expensive as regular cement.
And electrifying the cement industry won’t fully decarbonize it. The main challenge is eliminating the emissions associated with the production of calcium oxide. Numerous potential solutions are being explored and different technologies are currently under development. Some examples include: extracting calcium oxide from silicates instead of limestone (this does not release carbon dioxide), making cement using magnesium oxide instead of calcium oxide, or recombining CO2 captured from calcination with calcium hydroxide to recreate limestone. However, the scale of the cement industry poses a significant challenge to these alternatives. Limestone is abundant, cheap, and globally available, whereas these alternatives face issues related to material availability and cost. For example, even if all current bauxite extraction were diverted from the production of aluminum to the production of calcium sulfoaluminate cements, it would not be sufficient to provide more than 15% of the current demand. And to get the volume of magnesium silicate required to meet the demand for cement we would likely need deep-mining operations. As of 2023, it’s projected that alternative cements will struggle to meet even 10% of the demand for cementitious materials in the next two decades. Carbon capture and storage appears to be the most promising option of decarbonizing the cement industry in the short-to-medium term.
2.3.4 – Plastic
The worldwide annual production of plastic is approximately 500 million tonnes and is projected to reach 1 billion tonnes by 2050. Plastic has become an indispensable material across a broad spectrum of industries, including packaging, construction, automotive, clothing, furniture, toys, electronics, tire manufacturing, healthcare, and countless other areas of application.

Plastic is now so ingrained in the global economy that each $1,000 of GDP growth is associated with a 4 kg increase in demand (per person per year). In other words, as people get richer they use more plastic.

The problem is that plastics are derived from crude oil and natural gas, and they now contribute more than 4% of global greenhouse gas emissions throughout their lifecycle. The plastic industry uses about 5% of the world’s natural gas and crude oil output (equivalent to almost 10% of crude oil). This share could double in the next three decades if oil and gas production remains more or less the same.

It is possible to make plastic without the use of fossil fuels. We can utilize alternative feedstocks such as biomass (crops, cellulose, seaweed, algae, fungi, and cyanobacteria), methane and ethanol obtained from food residues, or synthesize hydrocarbon feedstocks from elemental carbon and hydrogen derived from air and water using renewable electricity. These alternatives usually result in lower carbon dioxide emissions and in some instances even achieve negative emissions as carbon from the atmosphere ends up stored in the plastic. However, alternative plastics can also be very resource-intensive – requiring large land areas or water volumes for growing biomass feedstock, as well as a high energy input.
For example, European Bioplastics reports that roughly 0.5% of the plastic produced in 2022 originated from plants and the crops used as feedstock were cultivated on approximately 10,000 square kilometers of land. Assuming no improvements in efficiency, this implies that replacing all fossil-based plastics with their plant-based counterparts would claim 2 million km2 of cropland – equivalent to 13% of the world’s total! It would be very challenging, if not impossible, to allocate so much cropland to plastic production given the growing global population and the increasing need for biofuels.

Another potential feedstock for bioplastic production is algae grown in open ponds or photobioreactors. But the scale required is still daunting. The highest productivity of open pond raceways is now around 0.5 grams of algae per liter per day. Assuming a conversion ratio of 1.5 kg algae to 1 kg bioplastic, to produce 400 million tonnes of bioplastic per year, these systems would require around 3.3 billion cubic meters of water! Photobioreactors achieve higher yields of around 5 grams per liter per day, therefore the water volume would be reduced to 330 million cubic meters. This equates to either 11 million open pond raceways of the size depicted in the image below, or 1.3 billion photobioreactors!

Of course, technical innovations are going to improve the efficiency and scalability of these processes. And we may not need to create so much bioplastic because certain packaging materials can be substituted by formed fiber products derived from trees and other lignocellulosic biomass. But given the scale of the plastic industry and its importance to the modern economy, it’s clear that a swift revolution of this sector is unfeasible. Oil and gas will almost certainly remain the primary feedstocks for plastic production in the next few decades.
2.3.5 – Aviation
Before the pandemic, the world’s commercial planes transported more than 4.5 billion passengers and 60 million tonnes of cargo every year, burned 300 million tonnes of fuel (7% of crude oil extraction), and accounted for 2.5% of CO2 emissions. Current projections estimate that annual air traffic will quickly recover to pre-pandemic levels and then almost double by 2050.
We don’t currently have the technology to easily decarbonize aviation using renewable electricity. Planes require high energy density fuels to fly great distances and batteries are still too heavy to replace them. Jet fuel contains over 20 times more energy per kilogram compared to the best batteries available today: 43 MJ/kg versus 2 MJ/kg. Despite electric motors being almost three times as energy efficient as traditional jet engines (90% versus 35%), this does not fully offset the lower energy density of batteries.
| Approximate energy density of possible aviation fuels | ||
| megajoules per kilogram (mass) | megajoules per liter (volume) | |
| Jet fuel (kerosene) | 43 | 35 |
| Bio-jet fuel | 43 | 35 |
| Batteries used in electric cars | 1 | 2.5 |
| Batteries used for drones and flying electric vehicles | 2 | 5 |
| Liquid hydrogen | 120 | 8 |
A hypothetical electric Boeing 787 loaded with 100 tonnes of cutting-edge batteries packing 2 MJ/kg, would achieve only ~10% of the range of a conventional Boeing 787 loaded with 100 tonnes of jet fuel. For example, if both planes took off from Rome, the conventional plane could go as far as Tokyo or Los Angeles. The electric plane on the other hand could only operate in Europe and North Africa. This limitation significantly hampers the commercial viability of electric jetliners, confining them to regional flights for the time being. Long-range battery-powered jetliners are still many decades away, if they’re even possible – the maximum theoretical energy density of lithium batteries is around 5 MJ/kg.

In order to maintain the functionality of jetliners, we must power them with alternative energy-dense fuels such as biofuels, liquid hydrogen, or synthetic fuels.
Bio-jet fuel can be derived from a wide variety of lipid-rich biomass like coconuts, palm kernels, soybeans, peanuts, or canola. It is compatible with conventional engines because it has similar properties and energy density to regular jet fuel. Several companies already run a few of their planes on a blend of fossil and bio-jet fuel derived mostly from used cooking oil. But the problem with biofuels lies in their extremely low surface power density – which means that their production requires vast areas of cropland.
For instance, if we assume a high global average power density of 0.25 W/m2 (equivalent to approximately 1.8 tonnes of bio-jet fuel per hectare), the production of 300 million tonnes would require 1.6 million square kilometers of cropland. This is roughly equivalent to 10% of the world’s total cropland! If we assume a more realistic power density of 0.1 W/m2, which corresponds to the average yield per hectare for vegetable oil in the United States, then we would need 4 million km2, or 25% of the world’s cropland! Given these staggering figures, it seems highly unlikely that we could power air travel with crop-derived biofuels, let alone meet the demands projected for 2050.

An alternative approach for bio-jet fuel production involves utilizing microalgae cultivated in open ponds and photobioreactors. Remarkably, algae are capable of yielding 10 to 100 times more lipids per unit area compared to traditional oilseed crops. Specifically, open pond systems can achieve a productivity rate of 0.5 grams of algae per liter per day, whereas photobioreactors can reach up to 5 grams of algae per liter per day. Depending on the species, algae’s lipid content can be more than 50% of its dry weight, and those lipids can be transformed into bio-jet fuel with as much as 70% conversion efficiency. Based on this conversion ratio of 3:1 from algae to bio-jet fuel, the production of 300 million tonnes of fuel would necessitate either 4.9 billion cubic meters of water in open ponds or 490 million cubic meters in photobioreactors. This equates to the water volume of about 16 million ponds of the size depicted in the picture below or 1.9 billion photobioreactors! Doable? Yes. Quick and easy? Not at all.

Two other ideas involve powering planes with hydrogen or synthetic fuels. These can be understood as electro-fuels or energy carriers in the sense that they are produced using electricity and act as storage mediums for that electrical energy. The main challenge of electric aviation is the limited on-board energy storage capacity of batteries. Electro-fuels overcome this limitation by storing the energy in the molecular structure of hydrogen or hydrocarbons, which deliver 20-60 times more energy per kilogram than batteries. However, this comes at the cost of energy efficiency: only part of the electrical energy ends up stored in the fuel (as most of it is used in the manufacturing process), and an even smaller share ends up powering the plane.
Let’s look at hydrogen first.
Hydrogen can be produced through water electrolysis and boasts a high energy content of 120 MJ/kg, which is 60 times more than the best available batteries. Jet engines can be adapted to run on hydrogen, as demonstrated in 1988 when the Soviet Tupolev-155 became the first experimental aircraft to fly on liquid hydrogen.

The major drawback of hydrogen is its low volumetric energy density: at atmospheric pressure, one liter weighs just 0.08 grams and offers a mere 0.01 MJ, which is 3,500 times less than jet fuel! Consequently, a Boeing 787’s tank filled with hydrogen gas would contain only 10 kg, equivalent to 1,200 MJ – insufficient even to move around the airport. To harness hydrogen’s energy effectively, it must be either pressurized to several hundred atmospheres or liquefied at -253°C. Yet, even under these conditions, the volumetric energy density remains modest: 7 MJ/l for hydrogen pressurized at 700 bar and just over 8 MJ/l for liquid hydrogen. This means that the fuel tanks of hydrogen-powered aircraft must be at least four times larger than those in traditional planes in order to deliver the same range.
Additionally, these tanks must adopt spherical or cylindrical shapes to evenly distribute the pressure exerted by the compressed hydrogen or, if storing liquid hydrogen, the tanks require substantial insulation to cope with the extreme cryogenic temperatures. These storage tanks usually weigh ten times more than the hydrogen they hold, and when you account for the total weight of the fuel system, the gravimetric energy density falls from 120 MJ/kg to less than 10 MJ/kg. This requirement for larger and heavier fuel tanks introduces significant design challenges that necessitate a complete overhaul of the aircraft’s fuselage to ensure proper integration and safety.

Spherical or cylindrical tanks cannot be integrated into the wings, where conventional jetliners store their fuel. Hydrogen tanks would likely need to be installed within the fuselage, positioned around the passenger compartment. Alternatively, the entire architecture of hydrogen-fueled aircraft may require reimagining, potentially leading to more voluminous designs or blended-wing configurations, as depicted in the Airbus conceptual rendering. Transitioning the aviation industry to hydrogen power would thus necessitate retiring the entire existing fleet of jetliners, which are designed for lifespans of up to 30 years, and replacing them with new, hydrogen-compatible designs.
Hydrogen-powered aviation would also be energy inefficient. The process of converting electricity to hydrogen via water electrolysis incurs a 20% energy loss. The subsequent steps of compressing or liquefying hydrogen add another 10% loss. The hydrogen would then be burned in engines that are about 35% efficient, meaning 65% of the fuel’s energy dissipates as heat rather than contributing to propulsion. The total energy loss would be about 75%. In other words, for every megajoule that moves the plane, we would need to generate four megajoules of electricity.

Synthetic hydrocarbons are a much more attractive option than hydrogen because they are “drop-in fuels”. This means they can be used in existing aircraft, as synthetic aviation fuel has almost identical properties to its fossil counterpart. The major drawback is that the production of synthetic hydrocarbons is very energy-intensive.
Synthetic aviation fuel can literally be made out of thin air using renewable electricity. To understand how this is possible, I’ll briefly explain the chemistry involved. Jet fuel is a blend of various alkane hydrocarbons, which are medium-chain molecules consisting of carbon and hydrogen. When hydrocarbons are burned, they release energy because the carbon and hydrogen atoms combine with atmospheric oxygen to produce carbon dioxide and water. Carbon dioxide (CO2) and water (H2O) are essentially the “spent” byproducts of the oxidation reaction, as shown in the graphic below.

The production of synthetic fuels is based on running this reaction in reverse through a process known as Power-to-Liquids (PtL). Using renewable electricity as the energy source, we can now transform carbon dioxide and water back into hydrocarbons, thus creating a viable method for producing carbon-neutral jet fuel for the aviation sector.

The procedure begins with Direct Air Capture (DAC), where CO2 and H2O are extracted from the air. After separation, the H2O undergoes electrolysis to yield H2 and O2, which are then separated. The H2 is combined with the CO2 in a reactor, where, under elevated temperature and pressure, a catalyst facilitates a reverse water gas shift reaction. This reaction converts a CO2 molecule and a H2 molecule into carbon monoxide (CO) and water (H2O). The CO is then separated and, along with additional H2, is subjected to the Fischer-Tropsch synthesis. This process causes the carbon and hydrogen to combine into various hydrocarbons, creating a product that mimics the composition of crude oil. Finally, these hydrocarbons are refined to produce different fractions, including middle distillates suitable for jet fuel. The lighter and heavier fractions may yield synthetic diesel, gasoline, various gasses, naphtha and waxes.
This sounds great, but the problem is that this process operates at a high energy loss. It takes at least two units of electrical energy to produce one unit of chemical energy in fuel. In other words, to produce one kilogram of synthetic jet fuel which contains 43 MJ, we have to spend at least 86 MJ of electricity. Given that jet engines are about 35% efficient, this means that for every megajoule that propels the aircraft, we must generate six megajoules of renewable electricity. Unless air travel reverts to being a luxury for the rich, it seems unlikely that synthetic fuel will be able to replace fossil jet fuel in the near future.
The takeaway is that, without a several-fold improvement in battery energy density, it’s not possible to power long-range aircraft directly with renewable electricity. In order to decarbonize aviation, we must either convert electricity to electro-fuels at high energy losses, or resort to biofuels, which are produced at low power densities.
Lastly, it’s important to recognize that only battery-electric planes could fully eliminate the warming effects of aviation, both globally and locally. While biofuels, hydrogen, and synthetic hydrocarbons might achieve carbon neutrality, they would still produce emissions like water vapor and nitrous oxide. These are potent greenhouse gasses that are especially impactful at high altitudes. Unlike carbon dioxide which becomes well mixed throughout the atmosphere, water vapor emitted by planes remains concentrated near flight routes, intensifying radiative forcing in those regions. Contrails (the water vapor trails from aircraft exhausts) actually contribute to more localized warming than the CO2!

At present, non-CO2 emissions account for about two thirds of aviation’s net radiative forcing. If air traffic doubles by 2050, the warming effect from non-CO2 emissions should exceed today’s total aviation emissions even if we’ll power planes with biofuels, hydrogen, or synthetic jet fuel. In particular, the use of hydrogen would result in significantly thicker contrails due to water being the main product of hydrogen combustion.
2.3.6 – International maritime shipping
Waterborne transport is the lifeblood of the modern economy. Cargo ships handle over 80% of global trade, moving roughly 12 billion tonnes of goods every year. This massive volume consists mostly of bulk commodities such as iron ore, crude oil, and grain, but also includes a staggering number of containers. Approximately 850 million containers passed through the world’s ports in 2023, transporting nearly two billion tonnes of stuff – anything from food and clothing to electronics and furniture. Many, if not most, of the items we find in our local malls and supermarkets have journeyed on a container ship at some stage.

More than 100,000 cargo ships are currently in operation, half of which are large or very large. These ships burn approximately 250 million tonnes of fuel per year (predominantly heavy fuel oil, supplemented by marine diesel fuel and liquefied natural gas) and emit over 800 million tonnes of CO2, accounting for 3% of the global total.
The decarbonization of shipping is hampered by the same obstacles as aviation: the low energy density of batteries, the low power density of biofuels, and the energy-inefficiency of electro-fuels.
Let’s consider battery-electric ships first.
The best available batteries are 22 times less energy dense than diesel fuel: 2 MJ/kg vs 45 MJ/kg. When these batteries are assembled into large packs or housed in containers, the energy density may drop to about 1 MJ/kg due to the added weight of components like casings, cables, and cooling systems. For instance, no electric car battery pack on the market today exceeds 1 MJ/kg: the 100 kWh battery pack of a Tesla Model S weighs around 600 kg and achieves an energy density of only 0.6 MJ/kg.
This low energy density would limit the cargo capacity of electric long-range ships because the weight of the batteries would displace potential cargo. In other words, a large part of an electric long-range ship’s load would be taken up by the batteries, leaving less capacity for cargo.
To illustrate, let’s consider the Maersk Triple E-class container ship, which has a carrying capacity of approximately 200,000 deadweight tonnes (fuel, cargo, ballast water, crew, and provisions) or 20,000 containers. These ships frequently undertake intercontinental journeys, such as from Eastern China to Northern Europe. An electric version of this ship, powered by a battery pack with an energy density of 1 MJ/kg, would only be able to carry about half the cargo of its conventional counterpart on a voyage from Shanghai to Rotterdam. This is because over 50% of the ship’s deadweight tonnage would be taken up by batteries, compared to just 2% for fuel in the conventional ship.

With present technology, electric cargo ships would only be economical for short voyages up to 1,500 kilometers. While this is a big limitation, it at least identifies a niche for electric cargo ships. The shipping industry’s trend towards containership gigantism has led to a hub-and-spoke trade model, where mega-containerships transport goods over long distances between major ports, such as from Shanghai to Rotterdam. From these hubs, smaller feeder ships distribute the containers to their final destinations in regional ports. As most of these feeder ships cover routes of less than 1,500 km, they could potentially be electrified. Thus, small electric cargo ships could be particularly effective in regions like the North Sea, the South China Sea, the Mediterranean Sea, or the North American Great Lakes.

To decarbonize long-range, gigantic cargo ships, we need to use alternative fuels with high energy density such as biofuels or electro-fuels (synthetic hydrocarbons, hydrogen, or ammonia).
Biodiesel can be produced from lipid-rich biomass such as oilseeds, coconuts, palm fruit, or algae. It has similar properties to regular diesel fuel and can be used in existing vessels with minimal modification. But crop-derived biofuels aren’t actually a feasible option because their production requires too much agricultural land. Assuming a high global average power density of 0.25 W/m2 (equivalent to approximately 1.8 tonnes of biodiesel per hectare), the production of 250 million tonnes would require 1.4 million square kilometers of cropland. If we assume a more realistic power density of 0.1 W/m2, which corresponds to the average yield per hectare for vegetable oil in the United States, then we would need 3.5 million km2. These values are roughly equivalent to 10-20% of the world’s cropland! It’s highly unlikely we could afford to allocate so much agricultural land for biodiesel production.

Alternatively, we could use algae as the feedstock. Assuming a conversion ratio of 3:1 from algae to biodiesel, we’d need either 4.1 billion cubic meters of water in open ponds or 410 million cubic meters in photobioreactors. Not easy.

By comparison, electro-fuels are a more promising option because their production can at least theoretically be scaled to meet the high fuel demands of the shipping industry. Synthetic biodiesel, methane, methanol, hydrogen, and ammonia can be made from water and air using renewable electricity. These fuels can then be burned in internal combustion engines or converted back into electricity for electric motors via fuel cells.
The production process for synthetic biodiesel, methane, and methanol is very similar to the process of creating synthetic aviation fuel, which I previously explained. It involves combining carbon captured from the air with hydrogen made by water electrolysis to produce hydrocarbons. However, the major drawback is that the use of synthetic hydrocarbons incurs a large energy penalty: at least 2 MJ of electricity is required to produce 1 MJ of energy in synthetic hydrocarbons, which are then utilized in engines that are about 50% efficient. This means that three-quarters of the invested renewable electricity goes to waste rather than in propelling the ship.
Today, most shipowners and industry analysts expect ammonia to be the shipping fuel of the future. As explained in the fertilizer section, ammonia can be made from water and air using renewable electricity via the Haber-Bosch process.

On paper, ammonia looks like a good fuel for ships. It is renewable. It can power both internal combustion engines and electric motors via fuel cells. It liquefies relatively close to ambient temperatures (-32°C) so it doesn’t need to be stored in high-pressure or cryogenic tanks. Liquid ammonia has ten times the energy density of batteries: 19 MJ/kg and 12 MJ/l. And many shipping operators already have experience with handling it as cargo for the fertilizer industry.
Leading engine manufacturers such as Wärtsilä and MAN are currently developing internal combustion engines that can burn ammonia with high efficiency. Once these engines are tested on a few ships, we will gain a clearer understanding of ammonia’s viability as a fuel for the shipping industry.

But green ammonia remains an energy-inefficient electro-fuel. With present technology, around 40 MJ of electricity is needed to make one kilogram of ammonia from water and air, whereas the energy content of that ammonia is only 19 MJ. Even if ammonia internal combustion engines match the excellence of marine diesel engines and achieve 50% efficiency, three-quarters of the invested electricity would be wasted rather than used to propel the ship. And while fuel cells could enhance ammonia’s efficiency, current models lack the multi megawatt capacity that would be required to meet a large ship’s electricity demands.
Given that ammonia is less than half as energy dense as regular shipping fuel, to substitute 250 Mt we would need to produce a minimum of 500 Mt of ammonia per year. This quantity is almost three times our current annual production of 190 Mt. Therefore, transitioning the shipping industry to ammonia fuel would necessitate an expansion of the ammonia industry by almost four times its current size, a scale that took over a century to achieve.
There are serious environmental concerns as well. Ammonia is highly toxic to humans and ecosystems and its combustion creates small amounts of nitrogen oxides (NO, N2O, NO2) which are potent greenhouse gasses and contribute to smog, ozone depletion, eutrophication, and corrosive rain. If just 1% of the nitrogen in ammonia would be converted to nitrous oxide (N2O), burning 500 Mt of ammonia would result in the emission of 6.5 Mt of N2O. Nitrous oxide has a heat-trapping capacity per kilogram that is 265 times higher than that of carbon dioxide. The global warming effect of 6.5 Mt of N2O would be equivalent to 1.7 billion tonnes of CO2 – more than twice as much as the current shipping emissions! In other words, just 0.5% of the nitrogen in ammonia has to be converted to nitrous oxide for the whole fuel transition to be pointless.
Ammonia leakage during production and usage would further perturb the natural nitrogen cycle (which is already severely destabilized by fertilizers) and promote eutrophication (algal blooms and dead zones). In the worst case scenario, the environmental impacts of ammonia may be compounded, giving rise to a cascade effect: a nitrogen atom leaking away as NH3 can contribute first to air pollution, then to water acidification in the form of NO2, then to eutrophication of water bodies, and finally to global warming and ozone depletion as N2O.
Despite these challenges, industry analysts are optimistic that technological advancements will allow us to minimize nitrogen oxide emissions and ammonia leakage, with some forecasts suggesting that ammonia could account for as much as 30% of shipping fuel by 2050. Or maybe this is just greenwashing. Time will tell.
The takeaway is that without a several-fold improvement in battery energy density, it’s not possible to power long-range ships directly with renewable electricity. In order to decarbonize international shipping, we must either convert electricity to electro-fuels at high energy losses, or resort to biofuels, which are produced at low power densities.
Key point #3 – Fossil fuels must be phased out, regardless of their advantages.
It is clear that modern civilization is powered by fossil fuels: they move us, they heat us, they produce our food, they transport us around the world, and they make most of our stuff. Some of our most important economic sectors are completely reliant on them, with no viable alternative for the time being.
So given our dependence on fossil fuels and their remarkable characteristics, one might wonder why we should give them up in favor of currently inferior renewable energy sources. The answer is that their extraction and usage result in air and water pollution, greenhouse gas emissions, ocean acidification, land transformation, and biodiversity loss. Additionally, they are non-renewable resources and sometimes contribute to geopolitical conflicts.
In this section, I’ll briefly describe the main reasons why we wouldn’t want fossil fuels to be our primary energy source in the long run:
- Air pollution
- Energy independence
- Long-term energy security
- Climate change
Air pollution
Fossil fuel combustion creates air pollution which is estimated to cause approximately 3 million human deaths per year due to respiratory and other diseases. The death toll on wildlife is many times worse, likely causing the deaths of hundreds of millions of birds and mammals each year, and perhaps billions of smaller creatures such as arthropods – though the exact numbers are not known. The main pollutants found in the air we breathe include: particulate matter (tiny solid or liquid particles which can be seen as soot, dust, or smoke), ground-level ozone (O3), heavy metals, sulfur dioxide (SO2), benzene (C6H6), carbon monoxide (CO), and nitrogen dioxide (NO2).
Transitioning to renewable energy won’t completely eliminate air pollutants because the combustion of biofuels and electro-fuels would still produce them in smaller quantities. But substituting fossil fuels with renewable electricity in certain areas like transportation and home heating would significantly improve air quality in cities, thereby saving human and animal lives.
Energy independence
Fossil fuel reserves are not evenly distributed worldwide. Some countries possess much larger quantities than others. This leads to a situation where countries with smaller reserves are reliant on those with larger ones, creating a state of energy insecurity. A prime example of this was seen during Russia’s invasion of Ukraine in 2022. The European Union, which was heavily reliant on Russian gas for heating, faced soaring energy prices when access to this resource was disrupted. The EU has since shifted to importing more liquefied natural gas from the United States and Qatar, proving the point once again: despite its small size, Qatar possesses more natural gas than the entire European Union; for example, it has over a thousand times more than Germany!

By comparison, solar and wind resources are much more evenly distributed. The sunniest deserts receive only two to three times more annual sunlight than cloudier northern regions like Ireland or British Columbia. This means that countries could achieve a higher level of energy independence by investing in their own solar parks and wind farms. But of course, even in a world powered by renewables, energy trading will continue to exist.
Long-term energy security
Fossil fuels are finite resources and will not be able to satisfy our energy needs indefinitely. To sustain a populous high-tech civilization for centuries to come, humanity ultimately has no choice but to transition to renewable and nuclear energy.
Contrary to common perception, fossil fuels will never ‘run out’ in a physical sense. Even if we wanted to, we couldn’t extract every last bit from the ground until none remained. This is because the extraction process would become uneconomical and would be discontinued long before complete depletion. The concept of fossil fuels ‘running out’ is more about economics than physical scarcity: when the energy used for extraction approaches the energy gained from burning the fuels, it’s no longer profitable to continue. With today’s technology, this typically happens when 20-40% of the resource still remains in the reservoir. For instance, modern techniques allow us to recover as much as 80% of the coal present in thick seams, but in the case of crude oil, even the best enhanced recovery methods leave behind about 40% of the original resource. In other words, we can now recover only about 60-80% of the fossil fuels in a reservoir before the energy cost starts to outweigh the benefit.
Furthermore, there are numerous low-quality deposits around the world where the energy return on investment is barely positive, and countless others where the energy required for extraction surpasses the potential energy yield. For example, thin coal seams (5-20 cm thick) buried half a kilometer underground are simply not worth mining because the energy cost of removing the surrounding rock would be much higher than what would be gained. If you look at a map of a country’s coal fields, you may be surprised to see that coal deposits cover a tenth of the land or more. However, most of that coal resource is typically in seams that are too thin and difficult to extract profitably, so they’re not actually viable energy sources. Similarly, crude oil is often found in small and difficult to access formations of oil sands, shales, and tar deposits that are not worth exploiting. These economic realities will ensure that a large share of the fossil fuels in place in Earth’s crust will never be brought to the surface.

In the context of fossil fuels, resources and reserves represent two distinct concepts. Resources denote the total mass believed to exist underground. Reserves refer to the part of resources that can be extracted economically with current technology. There is a vast discrepancy between these two quantities. A 2013 analysis by IEA estimated the energy content of all crude oil and natural gas resources at 64 zettajoules (ZJ) and those of coal at 600 ZJ, for a total of 664 ZJ. On the other hand, the energy content of the oil and gas reserves was estimated at 18 ZJ and those of coal at 26 ZJ, for a total of 44 ZJ. The recoverable reserves made up only about 7% of the total resources.
Still, fossil fuel reserves are enormous: roughly 80 times greater than our annual consumption. This implies that we could sustain current consumption for at least 80 years if we relied solely on known reserves.
| Reserves in 2020 | Global quantity used in 2020 | |
| Coal | 1,074 Gt | 8 Gt |
| Oil | 245 Gt | 4 Gt |
| Gas | 188 Tm3 | 3.8 Tm3 |
| Statistical Review of World Energy, BP (2021) Gt = gigatonnes or billion tonnes Tm3 = trillion cubic meters | ||
But historically, we’ve consistently underestimated the extent of both resources and reserves. As we explore more of the Earth’s surface, new deposits are discovered, leading to upward adjustments in resource estimates. Similarly, reserves have also been revised upwards due to technological advancements like horizontal drilling, hydraulic fracturing, floating oil rigs, and improved coal mining techniques, which reduce extraction costs or enable us to tap into previously inaccessible resources. For instance, U.S. production of conventional crude oil peaked in the early 1970s, and by the year 2010 it had decreased so much that it seemed the country’s reserves were nearing depletion. But then, drilling engineers figured out how to extract oil from shale (the source rock of conventional oil) through hydraulic fracturing. The adoption of this new technique not only reversed the decline in production but propelled it to new heights, allowing the United States to become the world’s top oil producer.

The consequence of continual discovery of new deposits and technological advancements is that fossil fuel reserves have remained relatively constant for several decades. In essence, the ‘end’ of oil has been perpetually about 50 years away. Given this historical trend, it’s possible that even 50 years from now, we’ll still have an estimated 50 years of fossil fuel reserves left.

So we don’t expect to run out of fossil fuels anytime soon. Crude oil, the resource that is most likely to be exhausted first, can remain plentiful at least until the end of the twenty-first century (if we want it to). That said, this trend of relatively constant reserves cannot persist for many hundreds or thousands of years. Fossil fuels would eventually become scarce, forcing humanity to transition to alternative energy sources. In the big picture, the fossil fuel era will be just a blip in humanity’s long history, as shown in the graphic below adapted from the work of physicist Tom Murphy. Making the transition to renewable energy now is simply doing what we would have to do eventually.

Climate change
The primary reason humanity wants to transition away from fossil fuels is to avoid excessive global warming.
Fossil fuel production and combustion generate greenhouse gasses such as carbon dioxide, methane, nitrous oxide, water vapor, and ozone. The presence of these complex molecules in the atmosphere contributes to temperature increase because they are transparent to incoming solar radiation (visible light) but absorb some of the outgoing infrared radiation (longer wavelength photons) emitted by the warm planet surface. This temporary absorption of outgoing infrared radiation slows the planet’s cooling rate, causing the average global temperature to settle at a higher level.
In this section, I’ll explain the mechanics of the greenhouse effect in greater detail. The core principle revolves around how photons interact with molecules.
Photons are the fundamental particles that carry electromagnetic energy and are created constantly throughout the universe in a wide variety of physical phenomena. For instance, they are created in stars during nuclear fusion, they are emitted when electricity runs through a conductor, and they’re even radiated by everyday objects around us, including our bodies. Depending on their source, photons carry varying amounts of electromagnetic energy, which corresponds directly to their wavelengths. These wavelengths span a vast range, from larger than a skyscraper to smaller than an atom, forming what we know as the electromagnetic spectrum. This concept is well understood, and many modern devices operate by emitting and absorbing photons at specific points along this spectrum. For example, radio utilizes photons with long wavelengths, Wi-Fi uses wavelengths about the size of a human, and medical X-ray machines use high-energy photons with extremely short wavelengths the size of molecules.

The earth receives energy from the sun in the form of radiation (photons) with wavelengths primarily in the part of the electromagnetic spectrum visible to the human eye (what we call daylight). About 30% of that radiation is reflected back into space by the upper atmosphere, clouds, and high-albedo surfaces like snow and ice. The majority of the remaining energy is absorbed by the planet’s surface (oceans, soil, rocks, plants, roads, and buildings), heating them up. Once heated, the planet’s surface cools by emitting infrared radiation, which consists of photons with longer wavelengths, back into space. Infrared radiation is invisible to the human eye but can be seen with night-vision goggles, thermographic cameras, or security cameras set to night-mode. Some snakes and birds can see a subrange of the infrared spectrum with the naked eye (seeing heat radiating from warm-blooded animals helps them locate prey).
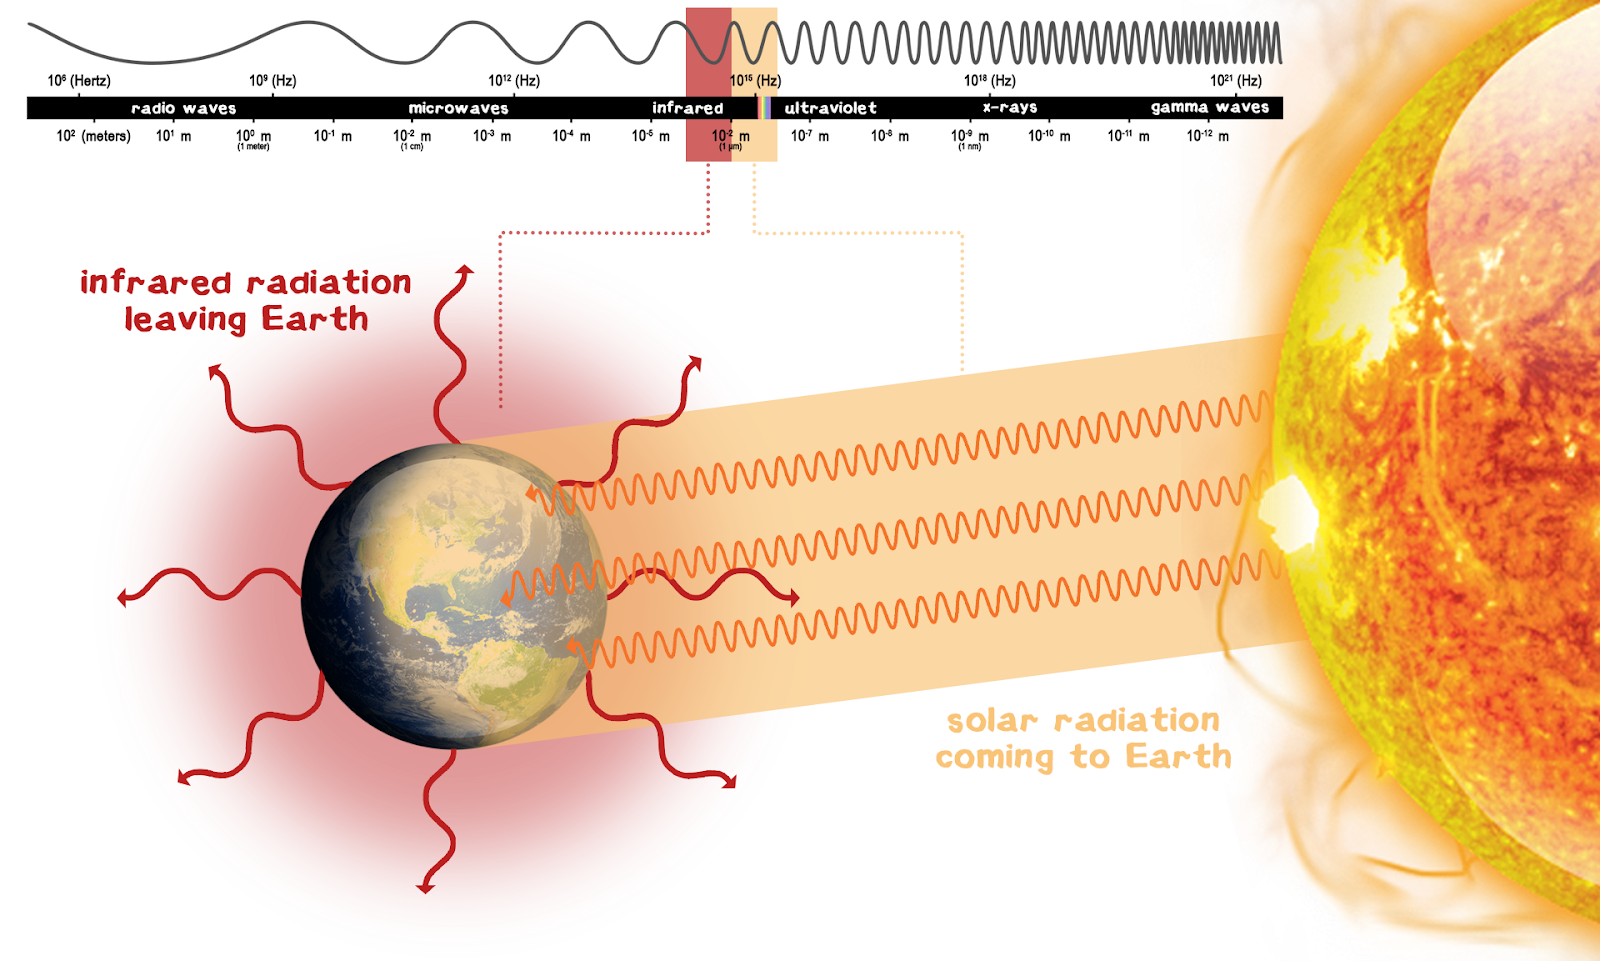
Heat can be very quickly dissipated through infrared radiation. Without an atmosphere, Earth would undergo drastic temperature fluctuations between day and night, similar to the conditions on the moon. Despite being practically the same distance from the sun as the earth, the moon’s surface experiences extreme temperature shifts, reaching up to 119°C in the day and dropping to -163°C at night. The reason Earth retains most of its heat during the night is due to its atmosphere, which contains greenhouse gasses. Greenhouse gasses reduce the rate at which infrared radiation escapes into space, tilting the thermal balance towards warmth. The way this works is really no different to how adding fiberglass insulation to your home helps maintain a higher temperature without requiring more energy from the furnace. The temperature of your house is intermediate between the temperature of the flame in your furnace and the temperature of the outdoors, and adding insulation shifts it towards warmth by slowing the rate at which the house loses energy to the outside. Without the insulation provided by greenhouse gasses, Earth’s average temperature would be -18°C, which is 33°C lower than the actual average of 15°C.

Water vapor and carbon dioxide are the primary greenhouse gasses on Earth, while methane, nitrous oxide, ozone and other trace gasses have lesser but still significant roles. These molecules are transparent to incoming shorter-wavelength visible light from the sun but absorb photons in the infrared spectrum. This selective interaction is explained by their molecular structure.
Under Earth-like atmospheric conditions in terms of temperature and pressure, only molecules composed of atoms of different elements exert a significant greenhouse effect; for instance, carbon and oxygen (CO2), or hydrogen and oxygen (H2O), or carbon and hydrogen (CH4). Molecules composed of two atoms of the same element, like nitrogen (N2) and oxygen (O2) – which make up around 99% of Earth’s atmosphere, do not absorb infrared radiation. There are several reasons for this. First, complex molecules composed of different atoms have a permanent dipole moment, meaning they have a distribution of electrical charge that allows them to participate significantly in energy exchanges with photons. Second, they have vibrational states that allow them to store more kinetic energy. And third, the energy jump between their vibrational states matches the energy of photons in the infrared spectrum.

How do the molecules vibrate?
Molecules such as H2O, CO2, and CH4 have vibrational modes that enable them to absorb energy through the stretching or compressing of atomic bonds. In the case of H2O, the molecule adopts a bent structure where the two H-O bonds form an angle of approximately 104.5° under stable conditions. This molecule can absorb energy by oscillating these bonds, akin to the flapping of butterfly wings. The CO2 molecule is linear and symmetrical, represented as O=C=O. It has two double bonds between the carbon and oxygen atoms. The positions of the oxygen atoms can oscillate to absorb energy, either by bending on either side of the average position, or by symmetrically or asymmetrically moving away from and approaching the carbon atom. And in the case of methane (CH4), the four hydrogen atoms can vibrate in different ways – stretching and compressing the C-H bonds, or bending these bonds relative to the carbon atom.

The more vibrational modes a molecule has, the more frequencies of infrared radiation it can absorb. Some of these modes are much more effective at energy storage than others, making molecules with more vibrational modes capable of absorbing more energy and thus, more potent as greenhouse gasses. For example, methane has 28 times the potency of carbon dioxide in absorbing infrared radiation, and nitrous oxide surpasses them both, being 265 times more effective than carbon dioxide. The most potent greenhouse gas known to us is sulfur hexafluoride (SF6), which has a warming potential approximately 23,500 times higher than CO2. It is primarily used to extinguish electric arcs in medium- and high-voltage switchgear, and although only a few thousand tonnes are used annually, it has contributed around 0.1% of all historical man-made warming.
But why do greenhouse gas molecules only absorb infrared radiation and are transparent to visible light?
In quantum mechanics, energy is quantized, meaning it exists in discrete amounts rather than a continuous range. For a molecule, the energy of its vibrational modes – the ways in which the atoms in the molecule can move relative to each other – is also quantized. Each vibrational state has a certain energy associated with it, and the molecule can only exist in these specific energy states. Photons also have specific amounts of energy, determined by their wavelength. When a photon encounters a molecule, it can be absorbed by the molecule if the energy of the photon matches the energy difference between two vibrational states of the molecule. In other words, the molecule can only absorb photons that have just the right amount of energy to cause the molecule to jump from one vibrational energy state to another. This explains why greenhouse gasses only interact with infrared radiation but are transparent to visible light, and why homonuclear molecules are transparent to both.
What happens to the molecules when they absorb the photons?
When a molecule absorbs a photon, it gains energy and transitions to a higher vibrational state. But greenhouse gasses on Earth cannot maintain high-energy states for longer than a few milli-seconds to a few tenths of a second. So the energy is quickly lost in one of two ways: through collisions with nearby air molecules or through decay, which means re-emitting an infrared photon in a random direction.

The first is the most common. The energy of the absorbed photon will almost always be assimilated by collisions into the general energy pool of the atmosphere. Molecular vibration is what we perceive as heat. This means that increasing the vibration of air molecules through collisions translates to a rise in temperature, effectively warming the atmosphere.
If the energy is not dissipated through collisions, the molecule decays (in less than a few tenths of a second) by re-emitting a photon in a random direction. Depending on its trajectory, that photon can be sent back to the planet surface, reabsorbed by another greenhouse gas molecule continuing the process, or directed outwards to space. The net effect of this random photon emission is that some of the infrared radiation lingers a bit longer in the atmosphere before eventually escaping to space, and this establishes a slightly higher temperature equilibrium.
The graphic below shows the full chain of events.

- The sun emits radiation with wavelengths mostly in the visible spectrum.
- Photons with those wavelengths pass through the earth’s atmosphere because their energy does not match the energy difference between two vibrational states of most air molecules, including greenhouse gasses.
- Sunlight heats up the earth surface which then cools by emitting infrared radiation.
- The energy of photons in the infrared spectrum matches the energy difference between two vibrational states of greenhouse gas molecules, so a part of them gets absorbed.
- When a greenhouse gas molecule absorbs a photon, it gains energy and transitions to a higher vibrational state.
- Once in a higher vibrational state, greenhouse gas molecules usually dissipate that energy through collisions with other air molecules, effectively warming the atmosphere.
- Alternatively, the greenhouse gas molecules decay by re-emitting an infrared photon in a random direction. Those photons can be sent back towards the surface or absorbed by another greenhouse gas molecule. This slows the rate at which infrared radiation escapes to space, establishing a higher planetary temperature equilibrium.
The following graphic illustrates the wavelengths of solar radiation reaching Earth and the infrared radiation emitted by Earth. It also highlights the specific parts of the spectrum absorbed by various greenhouse gasses and the parts that escape to space unhindered. This graphic is sourced from the freely available textbook Energy and Human Ambitions on a Finite Planet, written by physicist Tom Murphy.

Water vapor is the primary greenhouse gas on Earth, contributing approximately 60% to the overall greenhouse effect, which equates to around 20°C of the total 33°C. Water vapor is by far the most abundant greenhouse gas in our atmosphere and it has a rich set of vibrational and rotational modes that allows it to absorb effectively over a broad range of frequencies. Carbon dioxide is responsible for about 30% of the greenhouse effect, or ~8°C of the total 33°C. The remaining ~5°C is attributed to other trace gasses, primarily ozone, methane, and nitrous oxide.
However, the relatively small contribution of CO2 to the greenhouse effect doesn’t fully represent its critical role in regulating Earth’s temperature. CO2 is in fact the primary temperature regulator on Earth because, unlike water vapor, it is a non-condensable gas. The amount of water vapor the atmosphere can hold is limited by its temperature. If we wanted to warm the planet by making more water vapor, it wouldn’t really work because the extra moisture would quickly rain out and reestablish the equilibrium. On the other hand, carbon dioxide can accumulate in the atmosphere at any temperature and it can remain there for decades or even centuries.
If all CO2 were to be removed from the atmosphere, it would cool to a point where much of the water vapor would condense and rain out. This precipitation would trigger further cooling, propelling Earth into a globally glaciated state. It is the presence of CO2 that keeps the Earth’s atmosphere warm enough to hold a significant amount of water vapor. Conversely, an increase in CO2 would warm the atmosphere, leading to a higher water vapor content, a well-understood effect known as water-vapor feedback.
The graphic below shows the specific parts of the infrared spectrum absorbed by water and carbon dioxide. The first panel illustrates today’s atmospheric conditions, while the second one shows what would happen if the concentration of carbon dioxide in the atmosphere was increased. In this scenario, the CO2 absorption windows would expand, enabling carbon dioxide to absorb more wavelengths that currently escape into space unhindered.

Our total greenhouse gas emissions have so far caused global temperatures to rise by about 1°C compared to pre-industrial times. However, the oceans and melting ice currently mask the full impact of rising CO2 concentrations. Cold oceans and melting ice act as thermal energy sinks, heating at a slower rate than air and rock, delaying global warming in the same way that ice in a drink on a hot day slows its warming. With the current CO2 content in the atmosphere, we can expect a new equilibrium of around +1.7°C above pre-industrial levels once the oceans and ice catch up in terms of warming. In other words, even if we cut our greenhouse gas emissions to zero tomorrow, we should still see a ~0.5°C rise over the course of the twenty-first century.
| Year / scenario | CO2 concentration(parts per million) | CO2 concentration(percentage of atmosphere) | Warming |
| 1750 | 280 ppm | 0.028% | NA |
| 2024 | 420 ppm | 0.042% | +1.7°C |
| double 1750 level | 560 ppm | 0.056% | +3°C |
The greenhouse effect of carbon dioxide is more noticeable in cold, polar regions than in humid, tropical ones. In the tropics, the high air humidity already absorbs most of the outgoing radiation, which is why tropical nights are warm. In contrast, the dry air of polar regions doesn’t capture as much infrared radiation. Therefore, when CO2 is added to this dry air, it traps some of the infrared radiation that would normally be absorbed by water vapor in warmer regions. This partly explains why regions at higher latitudes have been warming much faster than temperate and tropical regions. The graphic below shows that, while global average warming has been around 1°C, some arctic regions have warmed by 3-5°C compared to pre-industrial times.

Climate models predict that doubling the atmospheric CO2 concentration from pre-industrial levels should result in an average global temperature increase of about 3°C. But this number is impossible to predict with absolute certainty. The temperature rise could be higher or lower depending on different factors and climate feedback such as ocean currents, cloud cover, plant growth, ice melt, methane emissions, and more.
To limit global warming to 2°C, as per the famous Paris Agreement, we have a remaining carbon budget of around 1,200 billion tonnes of CO2 (or at least, that’s our best guess). This equates to roughly 20 years of emissions at the current rate of 55 billion tonnes of CO2-equivalents per year (CO2 emissions, excluding all other greenhouse gasses, are 37 billion tonnes/year). To meet this target, we must leave a significant portion of known fossil fuel reserves untouched: one-third of oil, half of gas, and 80% of coal.

Of course, it’s unrealistic to expect fossil fuel use to drop from 100% to 0% at the end of that 20-year period. Instead, a gradual reduction can extend our carbon budget beyond 20 years. The graphic below shows several scenarios of how we could decrease our consumption at a gradually declining rate. For instance, if we start reducing CO2 emissions by 5% per year starting in 2024, we could continue using fossil fuels for more than 50 years before exhausting our budget. By the 50th year, our annual fossil fuel use would still be around 10% of the current level. The key point is that the later we start reducing emissions, the steeper the annual rate of decline must be, and the sooner we must end the fossil fuel era.

The predicament we face is that greenhouse gas emissions are still rising each year and are projected to continue to rise until at least 2030. Consequently, to avoid exceeding our carbon budget, we would need to implement an exceptionally steep reduction rate of around 10% annually post-2030. However, the likelihood of this happening is quite low.
Key point #4 – Warming in excess of 2°C relative to pre-industrial times is virtually guaranteed.
Can the global energy system be decarbonized in less than 20 years? Looking at the numbers, that seems highly unlikely. The biggest factors that prevent the rapid abandonment of fossil fuels are:
- The scale of the global energy system
Replacing our annual consumption of 16 billion tonnes of fossil fuels with renewable electricity requires the construction of hundreds of thousands of square kilometers of solar parks and millions of square kilometers of wind farms. In countries with high population densities and high per capita energy consumption, this could mean dedicating 10-50% of their land to renewable energy infrastructure. This transition also involves the construction of new high-voltage transmission lines, as well as the replacement of nearly all vehicles and most industrial infrastructure. However, mining the necessary materials and manufacturing these facilities is a slow process that is likely to span multiple decades, rather than just a few years. - Global energy demand is still rising
The global demand for energy and materials continues to increase every year due to population growth and the rise in living standards in developing nations. Based on current trends, the US Energy Information Administration forecasts that by 2050, global primary energy consumption will grow by 35%, from around 650 exajoules (EJ) to 900 EJ. This suggests that even if solar and wind energy were to increase tenfold until then, from 32 EJ in 2022 to 320 EJ in 2050, fossil fuel consumption could still remain around current levels (500 EJ/year). Therefore, the expansion of renewable energy must significantly exceed the growth of energy demand in order to allow for an increase in global energy consumption while simultaneously displacing fossil fuels. - The absence of cheap, high-energy density storage
The primary limitation of renewable energy is its intermittency. At present, we lack the technology to store energy cheaply on a large scale, which is necessary to counteract not only hourly and daily fluctuations but also seasonal and yearly variations. This limitation currently restricts the potential contribution of solar and wind to our power grids to between 30% and 60%. This means that renewable-heavy grids currently need natural gas power plants to serve as a backup 40-70% of the time. Until we develop the capability to depend on renewable energy around the clock, every day of the year, fossil fuels will continue to be the backbone of the economy. But if we develop cheap, high-energy density storage, most of our energy and climate problems will be solved. - High industrial dependence on fossil fuels as feedstocks, raw materials, and fuels
Renewable electricity isn’t a complete substitute for fossil fuels because they are currently required as raw materials, feedstocks, or fuels by hundreds of industries that manufacture the materials and products that define modern civilization (such as ammonia, steel, cement, and plastic). Fossil fuels also remain indispensable for transportation sectors such as trucking, aviation, and maritime shipping. The global demand for steel, ammonia, cement, plastic, aviation, and international shipping is projected to rise by 25% to 100% by 2050. To put it into perspective, the world will be building the equivalent of another New York City every month for the next 30 years! Therefore, in order to cover the increase in demand while simultaneously displacing fossil fuels, the rate of adoption of green material technologies and low-emission transportation needs to outpace the growth of demand. But most of these green technologies are not even commercially available or are just in the early stages of commercialization. - The Jevons paradox
Most roadmaps to zero emissions assume that part of decarbonization will be driven by efficiency improvements which will decrease global energy demand. For example, if engines become more fuel efficient and if manufacturing processes become more energy efficient, that would enable us to enjoy the same products and services while reducing our overall energy usage. A decrease in energy consumption would imply a reduced need for solar and wind energy installations and a decreased dependence on burning fossil fuels. However, in reality, efficiency gains can have the opposite effect. As observed by economist William Stanley Jevons in 1865, advancements in energy or manufacturing efficiency can paradoxically lead to a rise in total resource usage, rather than a reduction. He wrote: “It is wholly a confusion of ideas to suppose that the economical use of fuels is equivalent to a diminished consumption. The very contrary is the truth. As a rule, new modes of economy will lead to an increase of consumption according to a principle recognised in many parallel instances.” This paradox occurs because improving the efficiency with which a resource is used results in lower cost of use, which in turn induces increases in demand, causing overall resource use to increase rather than decrease. Here are a few examples:
– Over the last 50 years, the average fuel economy of passenger vehicles in the United States has doubled, from around 13 MPG in 1975 to 26 MPG in 2022. However, cars have also grown larger (every new model is bigger and heavier than the last), SUVs and pickup-trucks have surged to account for more than half the cars on the road, more people have purchased vehicles, and the average distance driven annually has increased. As a result, fuel consumption for passenger vehicles is at an all-time high.
– The fuel efficiency of jet engines has improved by around 35% since the 1970s. This improvement has made air travel more affordable, leading to a more than 30-fold increase in the total distance flown by passengers during the same period.
– The weight of aluminum cans (for beer or soft drinks) has decreased from around 20 grams in the early 1970s to just 12 grams in 2020. But the use of cans has increased almost 3-fold, leading to a 60% increase in aluminum demand.
– The efficiency of heating systems and air conditioning units has improved by more than 40% in the last 50 years. But the average size of homes has increased by a similar margin and the indoor temperature in winter has increased as well. In the late 1970s, the average winter temperature in British homes was around 15°C, which has now risen to around 18°C. This trend is mirrored in summer air conditioning usage. Today, some people set an indoor temperature in summer that would trigger their heating system in winter!
Of course, improvements in efficiency don’t always lead to increases in resource use. There are numerous instances where the Jevons paradox doesn’t hold true. Nevertheless, the human tendency to use more energy when it becomes more affordable makes it harder to transition away from fossil fuels.
Humanity is thus grappling with several energy problems simultaneously: the majority of our energy sources still emit greenhouse gasses; hundreds of millions of people are living in energy poverty; key materials for a decent quality of life are produced using fossil fuels with no readily available alternative; and our economic systems depend on a steady and increasing supply of energy to fuel growth.
Among these, the issue of energy poverty in developing countries is likely to be the most significant barrier to our efforts to quickly reduce greenhouse gas emissions.
The disparity in global energy consumption is staggering. The wealthiest billion people use four times more energy per person than the remaining seven billion, and ten times more than the poorest four billion. To illustrate, around 700 million people are undernourished and another 700 million lack access to electricity. 85% of all people alive today have never been on a plane. Four billion people inhabit less than 10 square meters of living space per person, which is less than a Western prison cell. Most homes in hot climates (such as Southern Asia, Africa, South America) do not have air conditioning. And more than half of the world’s population has yet to adopt the consumerist lifestyle that defines the 21st century.

In order for the world’s poorest four billion people to achieve a decent standard of living, they must at least double or triple their per-capita energy use. To match the living standards of Europeans, they must increase their energy use at least five-fold. So what will they do? Given that current technologies don’t allow developing nations to modernize using only renewable electricity, are they going to wait 10-20 years for low-emission materials and transportation to become commercially available or are they going to use current technologies in an effort to escape poverty as quickly as possible?
As of 2024, most developing nations are prioritizing energy security and economic growth over decarbonization. Fossil fuels are their primary energy source due to their technological maturity and their currently indispensable role in the manufacturing of fertilizer, steel, cement, plastics, and glass. Liquid fuels are also currently essential for mechanized agriculture, mining, transportation, and building basic infrastructure (roads, buildings, sewers, airports, etc). In international climate discussions, wealthy countries promise to shoulder the initial high costs of renewable technologies with the aim of reducing their price. This strategy is intended to enable developing countries to bypass the fossil-fueled development path they once followed, and instead, adopt renewable energy from the outset without a transition period powered by fossil fuels. But the global diffusion of these new technologies can take decades. In the meantime, emerging nations have been asserting their right to match at least a part of the historical per capita emissions of developed nations on the basis that extensive fossil fuel use is what enabled these nations to achieve their current prosperity.
The reality is that renewable energy has so far failed to meet our expectations of displacing fossil fuels in countries with rapidly rising energy demand. A striking example is China, which has been the uncontested world leader in solar and wind power development, multiplying its renewable electricity generation twenty-fold since 2010, from 50 to 1,200 TWh/year. Yet, its coal consumption has also increased by a billion tonnes in the same period, defying all forecasts, as shown in the graphic below. The latest forecasts of 2023, once again, predict that coal use will decrease in the next few years. Will they be accurate this time?

Similar patterns are evident in other developing economies, especially in Asia. For instance, India’s coal consumption has doubled since 2007 and continues to grow at a rate of 6% per year. Both Indonesia and Vietnam are ramping up their coal usage for power generation and material production. And several African countries have been rapidly expanding their oil extraction to facilitate economic growth. Can we talk about a swift transition away from fossil fuels when the global transition to fossil fuels is not even complete?
There’s no shortage of decarbonization scenarios that show how global fossil fuel usage could reach a plateau in the coming years and then sharply decline to nearly zero by 2050. But these are scenarios, not predictions. As long as renewable electricity remains unreliable due to lack of scalable and affordable storage, and fossil fuels remain necessary for transportation and manufacturing basic materials, it seems unlikely that developing countries will be able to modernize without them. Meanwhile, in rich countries, the abandonment of fossil fuels is delayed by the massive scale of the decarbonization project combined with the need to amortize the existing fossil fuel infrastructure. The transition is made even more challenging by the desire for steady economic growth, distrust in science and institutions, perceived threat to personal freedoms, corporate greed, political polarization, and the basic human tendency to discount the future in favor of short-term benefits.
Rapid decarbonization now appears to be possible only at the cost of maintaining low living standards in developing countries and economic retreat in developed countries. Understandably, people are unwilling to accept imposed lower standards of living (less money, comfort, stability, and social status) – let alone vote for such policies!
Given all these factors, some energy outlook reports, such as those from the EIA, forecast that fossil fuel usage and CO2 emissions will remain around current levels by the year 2050.

So what would this mean for climate change?
For every trillion tonnes of CO2 emitted by human activity, global mean temperature rises by 0.27°C to 0.63°C (best estimate of 0.45°C). If our greenhouse gas emissions do not gradually decline over the next two or three decades, we will undoubtedly exceed our carbon budget for limiting warming to 2°C, and possibly even exceed the one for 3°C. But it’s impossible to know for sure. While we can make predictions and forecasts based on the information we have, unexpected events can occur that may change the outcome for better or worse.
| Events that can accelerate decarbonization and/or limit warming | Events that can delay decarbonization and/or amplify warming |
| – Unprecedented global cooperation – Severe economic recessions – Societal transitions to plant-based diets – Mass deployment of breeder nuclear reactors – The advent of nuclear fusion – The invention of cheap, high-energy density storage – Large-scale reforestation and mass deployment of carbon capture technologies – Widespread shift to living and working in virtual reality worlds – Large volcanic eruptions – Large-scale geoengineering initiatives (such as injecting sulfur dioxide into the stratosphere) – Climate negative feedback loops (such as changes in cloud cover and ocean circulation) | – Rapid economic growth of several African and Asian countries, fueled by fossil fuels(akin to China’s rapid development) – Unwillingness or inability of developed nations to quickly phase out fossil fuels – Adoption of high-meat diets in developing countries – Large scale deforestation in Central Africa, Canada, and Siberia – Climate positive feedback loops (such as the melting of Arctic ice which reduces the earth’s albedo or the release of methane from thawing permafrost and of carbon dioxide from drying peatlands) |
Whenever imagining the future, it’s important to consider that long-term forecasts are almost always invalidated by unforeseen events or technical innovations. Looking back at past energy forecasts and targets, it’s quite astounding to see how they not only missed their targets by large margins, but that they ended up as complete failures, as humanity went in an entirely different direction. For example, in 1900 it was impossible to predict that we would be able to feed a much larger human population thanks to the invention of nitrogen fertilizers, high yielding cultivars, and mechanized agriculture. Similarly, in the 1980s it was impossible to predict the two events that had the biggest impact on the greenhouse gas emissions of the next three decades: the peaceful collapse of the Soviet Union and China’s emergence as the factory of the world. There’s no reason to believe we are better equipped to anticipate the magnitude of upcoming technological innovations or the major events that will influence the biosphere and human civilization in the next 75 years.
Key point #5 – Warming of 2-3°C relative to pre-industrial times is NOT an existential threat to humanity in the 21st century, but it is for many other species.
Climate change is projected to be disastrous for millions of individual humans and cause trillions of dollars worth of damages, but a prosperous technologically advanced civilization can endure and the wellbeing of humanity as a whole should continue to improve throughout this century. It is greatly exaggerated to use terms such as societal collapse, climate apocalypse, or human extinction when talking about the warming that will occur this century. There is no impending global apocalypse as far as humanity is concerned!
| Articles discussing climate change often employ titles and images that are designed to evoke fear or panic. I assume this is because heightened emotions tend to drive online engagement. However, such headlines often distort the reality of climate change, either through deliberate exaggeration or plain ignorance on the part of the authors. Rather than raising awareness about the real consequences of climate change, they inflict more harm on the cause. The danger lies in the fact that when apocalyptic predictions fail to materialize, public trust in the message erodes. It’s akin to the tale of the boy who cried wolf – when false alarms are repeatedly raised, people eventually stop believing in a real threat. I’ve created a few examples of absurd headlines below. I urge you to dismiss such messages or at least approach them with high skepticism.   |
However, this doesn’t imply that climate change will be harmless. Its effects are expected to be severe in many regions – negatively impacting hundreds of millions of people and likely causing many deaths this century from heatwaves, fires, floods, storms, disease, water scarcity, and crop failures.
In this section I’ll summarize the main negative effects of climate change. For an extremely detailed account see the IPCC’s Impacts, Adaptation and Vulnerability report (2022). For a summary of the most important points see the IPPC’s Synthesis Report (2023).
If current trends persist by the end of the century, the average global temperature will likely rise by 1-2°C, which is 2-3°C more than the pre-industrial era. The temperature increases will not be evenly distributed. Polar regions and deserts are expected to heat up a few degrees more than the global average (see maps below). This is partly because the greenhouse effect of carbon dioxide is more potent in dry air as it traps some of the outgoing infrared radiation that is otherwise absorbed by water vapor in regions with temperate and tropical climates. The main concern is that even modest warming will render some semi-arid regions unsuitable for agriculture and some desert areas uninhabitable for humans, including parts of the Middle East, North Africa, and the Kalahari Desert.

The human body cools itself mainly through sweating, a process where heat is absorbed as water evaporates, lowering the skin’s temperature. This cooling mechanism is effective as long as the wet-bulb temperature, a measure that combines temperature and humidity, stays below 35°C. This threshold is even lower for children, the elderly, and sick adults. With the progression of global warming, there’s been a rise in the number of days approaching the critical limit of 35°C, particularly in areas like the Persian Gulf and the Red Sea. Continued warming could make such days commonplace. Given that prolonged exposure to these conditions is intolerable for humans, some regions could become uninhabitable without air conditioning, or at least, prohibit people from working or living outdoors during the day.
The table below shows the approximate wet-bulb temperature corresponding to specific combinations of temperature and humidity. The colors highlight the levels at which these conditions pose a mortality risk for healthy human adults.

It’s also important to note that as global average temperatures rise, outlier highs become even hotter. For example, if the average temperature in a region rises by 3°C, the warmest summer day could become 6°C hotter. This is worrisome because just a few days of +45°C can kill a season’s crops as well as a large share of domestic and wild animals in the affected area. Extreme heat waves, draughts, wildfires, and crop failures should become more common in the second half of this century.
Global warming will be accompanied by sea level rise due to the melting of land ice (mountain glaciers and parts of the ice sheets of Antarctica and Greenland) and the thermal expansion of the ocean (as water warms, its density decreases slightly, leading to a larger ocean volume). By the end of the century, the average global sea level is expected to be about half a meter higher than today and continue to slowly rise for thousands of years. If warming is limited to 2°C, the global average sea level is expected to rise by about 2 to 6 meters over the next two thousand years. This delay occurs because heating the ocean and melting ice requires much more energy, and thus more time, than heating the atmosphere and land.

The IPCC forecasts that a half-meter rise in sea level will turn extreme sea level events and storm surges which currently occur on average once per century, into yearly events at more than half of the assessed locations around the world. This will result in frequent flood damage to infrastructure in those coastal areas, including some large cities. Still, a half-meter sea level rise should be manageable for most coastal communities worldwide. The main concern this century is for those living in low-lying delta regions and small islands, where seawater could submerge large areas of indispensable agricultural land or increase the salinity of soils, making them unsuitable for staple crops.
It’s estimated that by 2100, river deltas globally might lose 5% (~35,000 km2) of their surface area, which could be ruinous for the communities residing there. Two particularly worrisome cases are the Nile and Ganges deltas of Egypt and Bangladesh.

The Nile delta hosts 60% of Egypt’s agricultural land and approximately 45 million people, which is 40% of the country’s population. Elevation models reveal that 18% of the Nile delta lies below the mean sea level, 13% has an elevation between 0 and 1 meters, and 13% lies between 1 and 2 meters. The Ganges delta covers two thirds of Bangladesh (~100,000 km2) and hosts nearly 200 million people. About 10% of the delta lies one meter below sea level and 30% lies between 1 and 10 meters above sea level. Like most deltas worldwide, the Nile and Ganges deltas are subsiding at a rate of 1-5 millimeters per year, meaning the land is slowly sinking due to natural factors and human activities (such as river damming which reduces the flow of sediments to the delta, or groundwater extraction for irrigation). Subsidence coupled with rising sea levels results in a relative sea level rise that is twice the global average. The implications are severe: these deltas could lose some of their coastal lands to submergence, the groundwater level could rise enough to render some soils too wet for farming, seawater could infiltrate coastal lagoons and increase the salinity of aquifers and soils, and tens of millions of people could be forced to leave their homes or lands. However, these scenarios assume no coastal defenses such as seawalls and river embankments. If such defenses were to be constructed, the negative effects of a half-meter sea level rise could be mostly avoided, even in vulnerable deltas.

The inhabitants of small tropical islands will be the most heavily impacted by sea level rise and climate change in general. Even a half-meter rise in sea level will inundate small islands, cause saltwater intrusion into critical potable water sources, destroy coastal properties, and result in the loss of beaches that are currently tourist attractions and sources of income. For low-lying Pacific islands and atolls, coastal aquifers are the main source of freshwater supply, and sea-level rise will decrease their water quality. Moreover, increased ocean temperatures and acidification (due to CO2 absorption) will kill coral reefs and disrupt marine ecosystems, resulting in a reduction in marine biomass. This means that climate change directly threatens the most basic requirements for human life on these islands: habitable land, food, and potable water.

Rising sea levels will also increase the frequency of storm surge and overwash events, with surges reaching farther inland and inflicting more property destruction. 2°C of global warming is projected to increase the average intensity of tropical storms, resulting in a greater number of Category 4 and 5 cyclones. Given that small islands have low populations and economies, such storms could cause annual damages that exceed 5-20% of their GDP. Low-income communities who have historically contributed the least to current climate change will likely suffer the most.
Climate change is expected to displace tens of millions of people throughout this century, creating a new class of migrants known as climate refugees. These people will be forced to abandon their homes due to environmental changes like desertification or rising sea levels, and seek more hospitable places to live in other regions of their country or in foreign countries. Based on current trends, it’s possible that many nations will try to restrict the influx of climate refugees, claiming that it dilutes their cultures, disrupts social cohesion, or is too economically demanding. Such resistance is a cause for concern because it could potentially escalate into social and political tensions within host countries, or in the worst case scenario, lead to international conflicts over land and resources. “Climate wars” are unlikely, but cannot be ruled out as a possibility in the 21st century.
The table below summarizes the main negative impacts of climate change.

However, climate change will also have positive effects. Some regions will experience increased greening and crop yields due to CO2 fertilization, less need for irrigation due to decreased plant transpiration, higher rainfall, less need for heating in winter, and improved plant productivity at higher latitudes.
Despite the negative effects of climate change, average human well-being should continue to rise in the 21st century, with humanity as a whole becoming better educated, better fed, living longer and healthier lives, and experiencing less poverty, less war, less abuse, and less domestic violence. These positive trends have been ongoing for decades and are projected to persist. Currently, each unit of fossil fuels burned by humanity provides far more human well-being than suffering. The point at which this ratio flips appears to be many decades into the future. In vulnerable developing countries, causing 1-2°C of warming to lift hundreds of millions of people out of poverty should result in less overall human suffering than halting carbon emissions while denying those people the ability to rapidly improve their quality of life.
Let’s take food production as an example. One of the most common fears is that climate change will make it impossible to feed humanity by the end of the century. However, when we examine our current crop usage, farming practices, and agricultural land utilization, the likelihood of this happening appears to be quite low. Even if climate change were to reduce crop yields by say 20%, humanity should still be able to feed itself due to reduced food waste and obesity rates, adoption of predominantly plant-based diets, the development of heat-resistant crop varieties, enhanced agricultural productivity at higher latitudes, improved farming practices, increased double cropping, greater use of fertilizers and pesticides, and a decrease in uncultivated land.
Here’s the reasoning behind this.
First and foremost, developed countries currently produce vastly more food than would be required to adequately feed their populations. The daily food supply in all developed countries now exceeds 3000 kcal and 100 grams of protein per person, while the average daily requirement for a healthy adult (an average between males and females) is approximately 2200 kcal and 70 grams of protein. This large gap between the food supply and requirement is explained by extensive food waste and prevalent obesity.
The average westerner throws away 30-40% of the food they bring into their homes, a quantity equivalent to about 100 kilograms per year or 1000 kcal per day. The specific wastage rates are around 10% for meat, 20% for grains, and 20-30% for fresh fruits and vegetables. Notably, every unit of wasted meat in fact wastes at least three to five units of plant feed that were used to raise the animals. Given the scale and complexity of modern food production, trade, distribution, and preparation, it may be unrealistic to expect food losses lower than 15-20%; but the fact that as much as 40% of the food supply is wasted in affluent nations clearly indicates that people don’t really value the food they buy and afford to discard a large part of it.
Moreover, in all affluent countries, over half of adults are now overweight, and between 20-30% are obese. Globally, the number of overweight individuals has reached 2.5 billion, with around 890 million of them being obese. This means that those who overconsume food now outnumber the undernourished by more than threefold: 2.6 billion compared to 700 million. It’s evident from these figures that a substantial portion of the global population could easily reduce their food consumption by 10-20% without any adverse effects. In fact, their health would likely improve as a result.
Fears about food shortages should also be alleviated by the fact that most of the world’s agricultural land and a large portion of our grain, oilseed, and legume harvests are used for feeding farm animals rather than for direct human consumption. If a global food crisis were to occur, a transition to a predominantly plant-based diet could free up large amounts of grains and oilseed cakes to be consumed directly by humans, as well as large areas of agricultural land to be planted with crops intended for direct human consumption.
The Food and Agricultural Organization estimates that approximately 32 million km2 of land are used as permanent meadows and pastures for domestic grazing animals (an area larger than Africa) and around 4.5 million km2 of cropland are used to grow feed for farm animals (about a quarter of the world’s total). By comparison, the global cropland area used to produce plant foods for direct human consumption, biofuels, alcoholic beverages, coffee, tea, spices, cocoa, plant oils for making cleaning products and cosmetics, plant fibers for making clothes, and crops for other industrial uses amounts to a total of 11.5 million km2. The cropland area used to grow plant foods for direct human consumption may be as small as 7.4 million km²!
In rich countries it is now common for more cropland to be cultivated for growing animal feed than for crops intended for direct human consumption – even when the coproducts that are fed to animals are allocated entirely towards human food (such milling residues, alcohol residues, fruit pulp, expired food, etc). For example, I’ve calculated that in 2019, the European Union used around 290,000 km2 of cropland for animal feed production, while the cropland area used to produce plant foods for EU citizens was around 250,000 km2. When accounting for imports and exports, the global cropland area dedicated to producing animal products for EU citizens was around 345,000 km2 while the global cropland area used to grow plant foods for EU citizens was 320,000 km2 when including coffee and tea, and 300,000 km2 when excluding coffee and tea.

In 2019, the total quantity of wheat, corn, and other cereals used for direct human consumption in the EU amounted to around 59 million tonnes, while the total quantity of wheat, corn, barley, and other cereals used for animal feed amounted to 163 million tonnes – almost three times as much! This data comes from the FAO database and the annual agricultural outlook report published by the European Commission.

At the global level, approximately 900 million tonnes of grains are fed to animals every year, which is equivalent to about a third of the global cereal production. On top of that, almost all protein-rich cakes leftover from the extraction of oil are fed to animals as well, amounting to more than 300 million tonnes per year.
The conversion ratios of feed to animal products are roughly 1:1 for milk (dry weight), 3:1 for eggs and edible chicken meat, 5:1 for pork, and over 7:1 for sheep or cow meat. Therefore, in the conversion of these grains and oilseed cakes to animal products, we lose at least 20% of the protein and up to 70% of the calories. This means that direct human consumption of these resources would result in a minimum of 20% more protein and double the caloric intake, albeit with a decrease in protein quality (an acceptable tradeoff in times of crisis). Furthermore, the croplands currently used for growing animal feed like alfalfa, sorghum, clover, and various grasses, plus the arable portions of grazing lands, could be repurposed for cultivating high-protein, high-calorie crops for direct human consumption. In short, a worldwide reduction in the consumption of animal products could significantly boost the global supply of calories and protein.
In response to declining crop yields, humanity could also utilize agricultural lands more intensively. Currently, a significant share of the world’s cropland is left uncultivated for one growing season or more. Siebert and colleagues calculated that between 1998 and 2002, about 28% of the global cropland was not cultivated and the overall number of crops harvested per year was 0.82. That ratio means that if we assume a single crop was planted per hectare per year, global croplands were on average not cultivated once every five years. A more recent study by Estel and colleagues used satellite images to assess cropland-use intensity in Europe and reached similar results. They found that in the 12 years between 2001 and 2012, only around 42% of European croplands were planted every year, 18% were cultivated 5 to 8 times, and 5% were cultivated just 1 to 4 times. In the case of global food shortages, the annual share of uncultivated land could be reduced in an effort to increase food supply.
Moreover, we could increase the practice of multi-cropping. Multi-cropping means planting and harvesting two or more crops per year on the same land, for example, wheat followed by soy, wheat followed by corn, or two successive harvests of rice, peanuts, beans, or potatoes. Double-cropping (two crops per year) accounts for almost all of multi-cropping, (more than 95%), triple-cropping accounts for much of the rest, but there are a few regions where up to five crops of vegetables are harvested in a single year from intensively cultivated tropical land or under plastic mulch in subtropical areas. Waha and colleagues have estimated that between 1998 and 2002, around 12% of global cropland was double-cropped or triple-cropped and the latest data by Zhang and colleagues suggests the share has increased to about 17% between 2016 and 2018. This means about a sixth of the world’s cropland is now planted and harvested at least twice a year.

As shown in the map above, multi-cropping is most common in the tropical and subtropical regions of Asia, particularly in India, the Mekong Delta in Vietnam, and the North China Plain. It is also common in the Nile Delta, Nigeria, and Brazil. But it’s rare in North America, Europe, and Russia. If global warming will extend the growing season in these temperate regions, this will facilitate double-cropping. Thus, even if rising temperatures will diminish some agricultural yields, the impact could be partly or fully offset by increased multi-cropping, albeit at the cost of higher soil erosion, aquifer depletion, and fertilizer application.
And there are even more factors to consider. At the moment, large areas of cropland are dedicated to “luxury foods” such as almonds, iceberg lettuce, berries, avocados, coffee, and tea, which can have low yields per hectare or offer little nutritional value. These lands could be repurposed to grow crops with higher yields per hectare and higher calorie and protein content, such as wheat, corn, soybeans, peanuts, and potatoes. It may also be possible for us to develop varieties of these staple crops that are more resistant to heat and drought. An increase in atmospheric CO2 could also make plants more productive and more water-efficient, as their leaf pores wouldn’t need to open as much to absorb the necessary CO2, thereby reducing transpiration rates. Lastly, rising global temperatures could open up new agricultural lands in northern regions such as Canada and Russia.
In conclusion, despite the potential of climate change to reduce agricultural productivity, various factors should still enable us to produce the food we need. These include reductions in food waste and obesity rates, the shift towards plant-based diets, the development of superior crop varieties, enhanced agricultural productivity at higher latitudes, improved farming practices, increased double cropping, greater use of fertilizers and pesticides, and a decrease in uncultivated land.
The main point is that humans are highly adaptable and can learn to cope with climate change, especially as technology advances and we become wealthier.
But humans are not the only conscious creatures on this planet. When talking about other species, the effects of climate change can indeed be accurately described as catastrophic or apocalyptic. A quarter (!) of evaluated plant and animal species face a very high extinction risk this century due to rising temperatures, changes in rainfall patterns, and ocean acidification and deoxygenation. The loss of some foundational species are projected to have cascading effects that can drastically diminish local biomass and disrupt ecosystem services.
To illustrate this, I’ll provide three examples of foundational animal groups that are threatened by climate change: corals, shell-forming marine organisms, and terrestrial insects.
Coral reefs are calcium carbonate structures formed by coral polyps, which are tiny, soft-bodied organisms related to sea anemones and jellyfish. Coral polyps secrete layers of calcium carbonate beneath their bodies to form a protective shell. As these polyps go through their life cycle of living, reproducing, and dying, they leave behind their calcium carbonate skeletons which are built upon by the next generation. Over time, their skeletons accumulate and form the vast structures we identify as coral reefs.

Corals are considered a foundational species because they create the habitat of many other marine organisms. Despite only covering 0.1% of the ocean’s surface (about 300,000 km2), coral reefs are estimated to support approximately 25% of all marine species! But corals are very vulnerable to climate change. Even a slight increase in temperature, as small as 1-2°C above the usual local temperatures, can kill them because it disrupts the symbiotic relationship between the coral animal and the photosynthetic microalgae (called zooxanthellae) that live within it and provide most of its food. When coral reefs experience a marine heatwave, the photosynthetic apparatus of the microalgae is overwhelmed and they start to produce reactive oxygen molecules which are toxic to the coral. To survive, the coral is forced to temporarily expel the microalgae.

When symbionts are expelled, the coral skeleton becomes visible, leading to a phenomenon called coral bleaching. This is because the vibrant colors of corals are primarily provided by these symbionts. Without them, the skeletons usually appear pale white and the polyps appear mostly transparent, similar to jellyfish.

Expelling the microalgae is dangerous because the corals lose their main source of food. If the heatwave is brief, corals can reabsorb microalgae and recover. However, extended heat waves can lead to coral starvation. Currently, marine heatwaves often cause over 25% coral mortality, yet if the heat waves are infrequent, corals can largely recover. Climate change threatens corals by potentially raising average temperatures to levels currently seen during heat waves or by increasing their frequency, leaving corals with insufficient recovery time between bleaching events. According to current IPCC projections, a 2°C increase in temperature could result in the loss of nearly all corals.

The hope is that rising temperatures will cause a shift towards genotypes that can survive in warmer waters, or will cause current species to be replaced with closely related ones more tolerant of higher temperatures. For instance, certain species of corals in the Persian Gulf have demonstrated a superior ability to withstand heat compared to species found in most tropical regions or those inhabiting the Great Barrier Reef. There is already evidence of such adaptation: the average temperature causing coral bleaching events has progressively increased (slightly) over the past forty years. Recent evidence suggests that organisms can evolve much faster than scientists previously thought possible, particularly through epigenetics. However, the pace of temperature and acidity changes may still surpass the rate of natural selection, leading to the loss of the majority of coral reefs by the end of the century. Given that coral reefs provide the habitat for a large share of marine life, their decline could cause a cascade effect that significantly diminishes total oceanic biomass. This translates to the loss of trillions of sentient beings! The loss of life would be incomprehensible.
Ocean acidification has been called “the other CO2 problem” and has the potential to impact marine life much more severely than global warming. Ocean acidification refers to the ongoing decrease in the pH of seawater due to CO2 absorption from the atmosphere. The ocean absorbs roughly a quarter of our carbon dioxide emissions and this results in chemical reactions which increase the concentration of dissolved hydrogen ions (H+) and lower the concentration of carbonate (CO32-), as shown in the equations below.
When CO2 dissolves in seawater, it reacts with H2O to form carbonic acid (H2CO3).

Carbonic acid then dissociates into bicarbonate ions (HCO3–) and hydrogen ions (H+). Acidity refers to the concentration of hydrogen ions (H+) in a solution. Therefore, the release of hydrogen ions lowers the pH of surrounding water, making it more acidic.

Part of the hydrogen ions (H+) then react with carbonate ions (CO32-) present in seawater to produce more bicarbonate (HCO3–).

The lower concentration of carbonate ions (CO32-) suspended in seawater then promotes the dissolution of calcium carbonate materials, such as calcite and aragonite, which make up animal shells, skeletons, and coral reefs.

The net effects of CO2 absorption is an increase in seawater acidity (due to higher concentration of hydrogen ions), lower concentration of carbonate ions (CO32-), and increased solubility of calcium carbonate (CaCO3) materials.

Between 1950 and 2020, the average pH of the ocean surface fell from about 8.15 to 8.05 and the concentration of carbonate ions also declined, moving from roughly 235 μmol/kg to 220 μmol/kg. Since the pH scale is logarithmic, this means that the acidity of seawater has increased by around 30% in the span of just seven decades!
Marine organisms are impacted by lower pH because it leads to the acidification of their internal body fluids and tissues (acidosis) and makes it more difficult for them to build and maintain shells. The known effects are alarming:
- Neuronal Dysfunction: Acidification can compromise the functioning of the nervous system by altering the flow of ions across the neuron membrane, disrupting the normal functioning of neurotransmitter receptors, or lowering the sensitivity of nerve receptors to stimuli. This can change animal behaviors or diminish their senses, hindering their ability to find food, evade predators, and reproduce.
- Digestive Inefficiency: Animals may struggle to maintain optimal stomach pH levels, leading to decreased digestive efficiency. This is especially concerning for creatures that utilize external digestion, such as sea stars, but also impacts fish because whenever they feed they essentially open their digestive tract to the outside medium and ingest seawater.
- Metabolic and Growth Reduction: Higher bicarbonate concentrations can interfere with mitochondrial function in marine organisms and result in reduced metabolic rate. Additionally, lower pH can lead to stunted growth by down-regulating genes involved in protein synthesis, and in particular mitochondrial protein synthesis.
- Calcification Impairment: Lower concentration of carbonate suspended in seawater increases the energy required to construct external shells or internal skeletons.
- Shell and Skeleton Dissolution: Acidified seawater can cause calcium carbonate shells and skeletons to decrease in density or dissolve entirely.

Species that calcify are typically the most vulnerable to seawater acidification: molluscs, corals, echinoderms, crustaceans, and many species of phytoplankton and zooplankton. These organisms build shells and skeletons out of two chemicals that exist in seawater – calcium and carbonate.
Under normal pH conditions (~8.15 pH), calcium carbonate materials which make up shells and coral skeletons (such as calcite and aragonite) don’t readily dissolve in the ocean’s surface waters. They remain stable. This stability is due to the high concentration of carbonate ions, which are more than what the seawater can hold, a state referred to as supersaturation. In simple terms, seawater holds so many carbonate ions that additional carbonate is not prone to transfer from calcium carbonate materials to the water. However, when the ocean’s pH drops, the concentration of carbonate ions also decreases, leading to undersaturation. This makes seawater able to absorb more carbonate ions and thus promotes the dissolution of calcite and aragonite which make up shells and coral skeletons.

Experiments show that when some shell-forming marine organisms, such as pteropods, are exposed to seawater pH levels anticipated for the year 2100 (approximately 7.9 pH), the growth rate of their shells is diminished due to decreased saturation of carbonate ions, which increases the energy required to construct calcium carbonate structures. Furthermore, these organisms may struggle to maintain shell integrity as the rate of dissolution can surpass their ability to calcify. Consequently, they exhibit thinner shells, ragged and dissolving shell ridges, and perforations throughout the shell, as shown in the pictures below.

For instance, when exposed to the pH levels anticipated for seawater in 2100, the pteropod species Limacina helicina experienced a 28% decrease in calcification. Similarly, Clio pyramidata, another pteropod species, began to show shell dissolution within 48 hours when subjected to the level of aragonite under-saturation projected for the Southern Ocean’s surface waters by the year 2100.
Current data indicates that ocean acidification poses a serious threat to marine biodiversity, potentially causing a mass extinction. The primary concern stems from the anticipated decline in calcifying phytoplankton (such as coccolithophores and microalgae) and zooplankton (such as pteropods, foraminifera, small crustaceans), which serve as the main food source for numerous marine species.

For instance, pteropods can reach densities of up to 10,000 individuals per cubic meter of seawater in the Southern Ocean and are a key food source for fish. Similarly, foraminifera, which are tiny organisms that construct calcium carbonate shells, are crucial in the diets of snails, shellfish, crustaceans, and echinoderms, all of which are vulnerable to acidification. The potential decline of these shelled organisms could disrupt predator-prey interactions and trigger ripple effects throughout ecosystems. Such a scenario could lead to a significant reduction in total marine biomass, implying a drastic decrease in oceanic life. This translates to the loss of countless individual organisms, possibly in the quadrillions or quintillions, including sentient beings.
Terrestrial insects face a multitude of threats due to climate change. For example, temporary warm periods in late winter may cause insects to emerge prematurely, only to die when cold temperatures return or there is a shortage of food. Other threats are drought and habitat loss, which could cause starvation or force insects to migrate to higher latitudes or elevations where they would face increased competition for resources. But here I’d like to draw attention to an unexpected way in which warmer temperatures can lead to insect decline: lower fertility due to reduced sperm quality.

Sperm cells in many animal species are highly sensitive to temperatures approaching or exceeding 40°C. This is the reason why in warm-blooded animals like mammals, evolution has led to the testicles being housed outside the body in the scrotum, ensuring spermatogenesis occurs at temperatures a few degrees cooler than the body’s internal temperature. While this area of research is still in its infancy, there is preliminary evidence that global warming and frequent, intense heat waves could lead to diminished fertility or even sterility in some animals, including numerous insect species.
For instance, when male flour beetles were exposed to a simulated 42°C heatwave for 5 days, they showed a 75% reduction in ejaculate sperm number, and only one third of those sperm cells were alive. Moreover, the living sperm cells showed reduced ability to move through the female reproductive tract, leading to a lower number of fertilized eggs of which only about 40% successfully hatched. There was also evidence of transgenerational damage. The offspring produced from those sperm cells had shorter lifespans and showed a 25% reduction in mating success. Other research has found that fruit fly males become sterile at temperatures above 30°C, and that male bumblebees show a 20% decrease in live sperm when subjected to a temperature of 45°C for a duration of 90 minutes.
We now know almost for certain that insects are conscious creatures, and are capable of much more sophisticated subjective experiences than we previously thought possible. Given that they number in the quintillions of individuals, even a 10% reduction in their abundance due to impaired reproduction would mean an enormous loss of conscious life, beyond what humans can even comprehend.
My moral intuition is that consciousness should be the basis for moral consideration. If a being has the capacity to experience its existence, it is morally wrong to terminate its stream of consciousness or cause it suffering. Therefore, I believe that even indirectly causing the death of trillions of conscious beings is a severe moral wrongdoing. If it is indeed possible for human wellbeing to continue to improve this century despite the effects of climate change, then I think the primary motivation for swiftly transitioning away from fossil fuels should be to protect animal life. It is worthwhile to spend large sums of money and make personal sacrifices for the sake of other sentient animals.
The IPPC warns that biodiversity loss escalates with every increment of global warming. So if we acknowledge the moral significance of other sentient beings, as I think we should, the impact of human-induced climate change can be equated to a form of mass destruction akin to genocide. In other words, when considering the moral worth of other species and not just that of humans, emitting large quantities of greenhouse gasses is a terrible crime.
The use of fossil fuels thus presents a case of injustices and inequalities. While the wellbeing of humanity as a whole can improve despite climate change, a subset of the population faces ruin and increased mortality, accompanied by environmental degradation, suffering, and mortality of non-human species.
Key point #6 – The transition to renewable energy is possible. Several high-income countries are on track to get the majority of their energy from non-fossil sources by 2050. Achieving global net-zero greenhouse gas emissions is expected to be a lengthy process, taking multiple generations to complete.
Most people think that greenhouse gas emissions from developed nations such as the United States and European Union members are at an all-time high, but in reality, they have been steadily decreasing over the past few decades. You can see this in the charts below or on this interactive map.

This downward trend has been driven primarily by the following factors:
- Widespread shift from coal to natural gas in electricity generation (this reduces the CO2 intensity of electricity by as much 50%)
- Increased energy efficiency of common converters (internal combustion engines, gas turbines, furnaces, light bulbs, household appliances, and electronics use less fuel and electricity today than they did three or four decades ago)
- Improved insulation of buildings
- Reduced energy demand of industries and agriculture per unit of delivered product
- Improvements in manufacturing processes
- Transitioning from industrial to service economies and outsourcing energy-intensive manufacturing industries to low-income countries (the greenhouse gas emissions resulting from the production of goods in China or Vietnam, are attributed to the producing country rather than the countries that import these goods)
- Lower birth rates and aging populations
- The construction of large-scale hydroelectric dams and nuclear power plants
These changes have led to large reductions in greenhouse gas emissions in most developed countries and are estimated to have already averted approximately 1°C of future warming. The average annual global emissions per capita appear to have reached their peak in 2012 at 4.9 tonnes of CO2, and have since slightly dropped to 4.7 tonnes. The reason total emissions continue to rise is due to population growth and due to the rise of hundreds of millions of people from poverty to a decent quality of living.
So far, decarbonization has had little to do with the displacement of fossil fuels by renewable energies, but in the last decade, wealthy nations have made rapid progress towards building their wind and solar generation capacities and electrifying their economies. There are now many reasons to be optimistic that high-income countries will be able to get more than half of their primary energy from renewables by 2050.
The share of renewable energy in the primary energy mix of high-income countries like the United States, UK, Germany, or Japan is now growing at a rate of 1-2% per year. If this growth rate continues, renewables could account for over 60% of these countries’ primary energy by 2050. The primary hurdle is now the intermittency of solar and wind energy. Without affordable, long-term, high-capacity storage solutions, the share of solar and wind in our power grids could be limited to 30-60%.

The transition from internal combustion engines to electric motors and from coal-based electricity to renewable electricity is predicted to reduce primary energy demand. This is due to the fact that 60-75% of the chemical energy in fossil fuels is wasted as heat during conversion to kinetic or electric energy. Assuming that these gains are not offset by other inefficiencies in the renewable energy system or the Jevons paradox, each percentage point increase in primary energy derived from wind or solar power today could represent a larger portion of total energy demand in the near future.
The cost of solar and wind continues to decline rapidly. The price may soon fall low enough to allow for the deployment of high-efficiency solar photovoltaics capable of achieving average power densities of 50-100 W/m2 on rooftops and 25-50 W/m2 in solar farms. This would alleviate the problems of land use and high material demand. Still, the costs associated with intermittency and storage in renewable energy systems must be further reduced. Today, despite solar and wind power being the cheapest options for new electricity generation, countries with the highest shares of solar and wind electricity in their grids tend to have the highest electricity prices.
Developed countries are also driving the innovation of new methods for reducing iron ore without fossil fuels, for making bioplastics, for synthesizing ammonia with green hydrogen, or making cement with fewer carbon emissions. By the year 2050, several new techniques for producing humanity’s essential materials without fossil fuels should be commercially available. All these factors contribute to optimism that the carbon emissions of high-income countries can be cut to less than half the current levels by the middle of the century.
Still, the rate at which the world decarbonizes will ultimately be determined by lower-income countries. We must not forget that fewer than 1.5 billion people are “rich” in any sense of the word, while more than 4 billion still live in energy poverty.

Around 800 million people still burn wood and straw and even dried dung for everyday activities, the same fuels that their ancestors used two thousand years ago. In stark contrast, the average American or European emits more greenhouse gasses in a week than people in poor countries (such as Ethiopia, Uganda, or Malawi) emit in an entire year. This won’t always be the case. Poverty rates are falling rapidly all over the world, and as people improve their living standards, their emissions are inevitably rising as well. This is great for human wellbeing, but it poses a significant challenge for climate change mitigation.
To give you an example, if Africa were to replicate China’s post-1980 rise in per capita energy use, its current fuel and electricity consumption would have to increase roughly tenfold, and if it were to match China’s per capita steel consumption, its annual steel production would have to increase more than 50 times. Similar increases would be observed for fertilizers, glass, plastics, and microprocessors.
The following charts show how emissions from populous lower-income countries have been increasing over recent decades, compensating for the reductions made by wealthier nations.

The current hope is that lower-income countries will adopt green technologies as soon as they become commercially viable, thereby avoiding the traditional development path fueled by fossil fuels that countries like China and India have taken. Time will tell. As the saying goes, the ball is now in their court.
Key point #7 – There are ways you can support the transition to renewable energy.
Who bears the greater responsibility for climate change: the corporations that extract fossil fuels and produce energy-intensive goods and services, or the individual consumers who purchase these products and services, thereby fueling the profits of these corporations?
I think the correct answer is both. It’s a chicken and egg kind of situation.
On one hand, it’s undeniable that companies focused on profit are driving pollution by constantly launching and marketing new products and swaying politicians to enact policies that favor their enterprises. On the other hand, these products are made to satisfy consumers. They are the ones who purchase the goods produced by these companies and enjoy the benefits. The money of consumers is what keeps these companies operational and ultimately finance fossil extraction and carbon emissions.
Corporations and consumers are now passing the blame on one another like a game of hot potato. Big polluters have popularized the term “carbon footprint” in a strategic move to shift the narrative about climate change mitigation away from themselves and onto consumers. They try to present themselves as neutral agents in this issue, merely supplying fossil fuels and other energy-intensive products, with the choice to consume them lying with the public. On the other hand, individual consumers argue that they shouldn’t be held accountable for their consumption habits because it’s the corporations’ responsibility to provide environmentally friendly products. They, too, attempt to paint themselves as neutral agents in this issue, as if they are simply entitled to all the goods and services they desire, and it’s up to the corporations to figure out how to eliminate the pollution, even if the required technologies are not even available yet (as in the case of flying, manufacturing basic materials, international shipping, high-yield agriculture, etc).
What is clear is that consumption of all kinds, regardless of who drives it, is the primary cause of greenhouse gas emissions. The only years in recent history that global greenhouse gas emissions have decreased significantly have been during economic downturns when people consumed less, such as the Great Recession of 2008 or the Covid-19 pandemic. This might tempt you to conclude that the solution to climate change is simple: companies need to produce less stuff or consumers need to buy less stuff. But the conundrum is that our economic structures are such that we cannot consume less without triggering a recession. In other words, we need to consume less, but we can’t consume less. In the 21st century, high consumption is not a choice, it’s a necessity – as long as we want economic abundance.
Everyone’s income depends on someone else’s expenditures. If consumers suddenly decided to boycott big polluters, the revenues of those corporations would fall. Since big polluters employ hundreds of millions of people and purchase products and services from millions of other small businesses and freelancers, lower revenues would cause them to lay off workers and cut expenditures of all kinds. Incomes would fall like dominos. Eventually, the same consumers who decided to boycott the big polluters would earn less income. Thus, if tomorrow’s consumerism dropped by say, 15% worldwide, we would get a downward spiral where hundreds of millions would lose their jobs and humanity’s material abundance would decrease. Some economists call this a “consumption disaster”. Throughout history, consumption disasters have had dire consequences for human well-being, ranging from high unemployment rates to hunger, political upheavals, and civil war.
So the power of individuals to stop climate change is very limited. Even if you stopped using fossil fuels for the rest of your life and went to live in a cave somewhere, the CO2 savings accumulated over your lifetime would be offset in a matter of seconds by other individuals who are now rising out of poverty. The real solution lies in systemic change: an economic model that does not require perpetual GDP growth, can function with moderate levels of consumption while maintaining low unemployment, and promotes rational energy use (no wasteful vehicles, planned obsolescence, single-use items, etc). The problem is, we have not yet discovered such an economic model, or at least not one that can function in free, democratic societies.
But individuals can at least help shift society’s values towards the goal of climate change mitigation and protection of sentient animal lives. Each one of us influences others through our visible choices. Ideas and values are contagious and can spread from one person to the next until new social norms are established. This is how moral progress occurs – it all starts from a small group of individuals.
Here are a few things you can do to support the transition to renewable energy:
1. Have a basic understanding of the technical challenges involved in the transition to renewable energy, how the greenhouse effect works, and the risks of climate change.
Global warming and the transition to renewable energy will impact many aspects of the economy, our daily lives, and future ambitions. Only by understanding the core issues can you productively contribute to discussions on how to effectively reduce greenhouse gas emissions. This foundational knowledge will also protect you from misinformation and conspiracy theories, enabling you to critically evaluate policies and become a more informed voter. I hope that this content has equipped you with this essential knowledge.
2. Share what you know with your friends and family.
Not everyone has the time or interest to delve deeply into this subject. If you’ve mastered the basics, consider sharing your knowledge with friends and family. You could bring it up during dinner conversations or on lengthy road trips, for instance. In my experience, some of the insights I’ve shared have captivated many of my friends. In fact, I’ve been invited on several occasions to hold presentations on this topic to small gatherings of friends and acquaintances.
3. Support legislation that mandate companies to meet specific environmental protection goals, or that impose restrictions on personal consumption through taxation or increased pricing.
Many people are quick to attribute the majority of carbon emissions to large corporations, asserting that it’s the duty of these businesses or governments to curb emissions. However, the same individuals often oppose policies aimed at achieving this goal, such as fuel standards, building codes, or increased taxes on energy-intensive commodities. It’s inconsistent to absolve oneself of responsibility for reducing greenhouse gas emissions while also opposing governmental efforts to do so. If you believe that it’s the government’s job to cut down emissions, then you should support their initiatives, even if it means higher taxes, price increases, or restrictions on certain products. There doesn’t seem to be an easy solution to this problem – sacrifices will have to be made.
4. Reduce your personal greenhouse gas emissions.
Individual actions to reduce greenhouse gas emissions cannot stop climate change, but they can at least steer the market towards sustainability. By choosing ‘green’ products, you can support the companies that produce them and encourage the market to follow suit. This includes installing solar panels, purchasing long-lasting electronics, or opting for plant-based meat substitutes. These choices not only support the respective companies but also contribute to reducing their prices. Similarly, using low-carbon transportation like public transit can influence city infrastructure towards sustainability. Therefore, consider your personal carbon reduction not as a solution to climate change, but as a catalyst for market transformation.
I’ve put together a checklist that shows how to reduce your energy use and carbon emissions as well as which actions have the biggest effects. It is available for download here.
5. Spend more of your disposable income on services rather than physical products, fuels, and electricity.
Adopting eco-friendly technologies and minimizing unnecessary consumption can lead to significant monetary savings. For instance, using a more efficient heating system, driving an electric vehicle, and upgrading electronics less frequently can save you a few hundred dollars each month. Over time, these savings can accumulate, providing you with extra money that you didn’t have before.
What most people do in this scenario is spend that money on energy-intensive products or experiences, such as home renovations or vacations to far-off tropical beaches. These choices can completely negate the carbon emission savings achieved. For instance, a single intercontinental flight can consume as much fuel per passenger as heating your home throughout winter.
To avoid offsetting your carbon savings, it’s important to resist spending money on energy-intensive products and experiences. This can be challenging, as almost every way we spend money leads to greenhouse gas emissions in one way or another. My advice is to try to spend your money on services rather than goods. Consider investing in experiences like attending games, joining sports clubs, enrolling in courses or workshops, watching movies, or visiting spas. This way, you can enjoy your savings while still maintaining your commitment to reducing carbon emissions.
6. Consider working in the renewable energy business or becoming an engineer or researcher dedicated to phasing out the use of fossil fuels in the production of essential materials and transportation industries.
As I’ve explained throughout this guide, we currently haven’t perfected the technologies that enable us to make essential materials without fossil fuels or to fuel jetliners or intercontinental ships. Our ability to phase out fossil fuels will rest on whether we will be able to make these things with renewable energy.
Throughout this guide, I’ve emphasized that we do not yet have the technology to produce some essential materials or power jetliners and cargo ships without fossil fuels. The success of our transition away from fossil fuels hinges on our ability to accomplish these tasks using renewable energy sources. Therefore, we need more engineers, researchers, and entrepreneurs to work on these projects.
Imagine the economy as a pyramid. The base, which supports our modern civilization, is composed of fundamental industries such as agriculture, food production, mining, construction, manufacturing, transportation, utilities, and electricity generation. These sectors form the bedrock of our economy, providing the essential resources we need to function. Ascending the pyramid, we find the service, software, banking, and finance industries. These sectors, while important and very profitable, are entirely dependent on the foundational layers beneath them. It’s a logical hierarchy: without electricity, there would be no software engineers; without steel and cement there would be no interior designers; without efficient food production there wouldn’t be anything else.

The modern economy tends to lure young professionals towards its upper levels, where high-paying roles in service sectors and the finance and banking sectors (such as law, management, consultancy, coaching, design, cryptocurrency, business development) are abundant and the entry barriers are relatively low. While these roles are undoubtedly valuable, they don’t typically contribute to the transition towards renewable energy. In fact, they might encourage increased fossil fuel consumption, as their growth is tied to the expansion of the fundamental industries at the base of the economic pyramid. Therefore, if you’re driven to effect systemic change, particularly in the realm of renewable energy, consider a career in these foundational industries. Roles such as engineer, researcher, or entrepreneur in these sectors can offer a direct path to influence and innovation.